Roles
User Research
UX/UI Design
Visual Design
Prototyping
Strategy
Overview
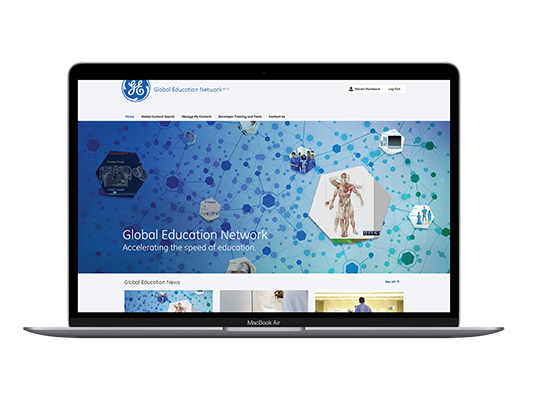
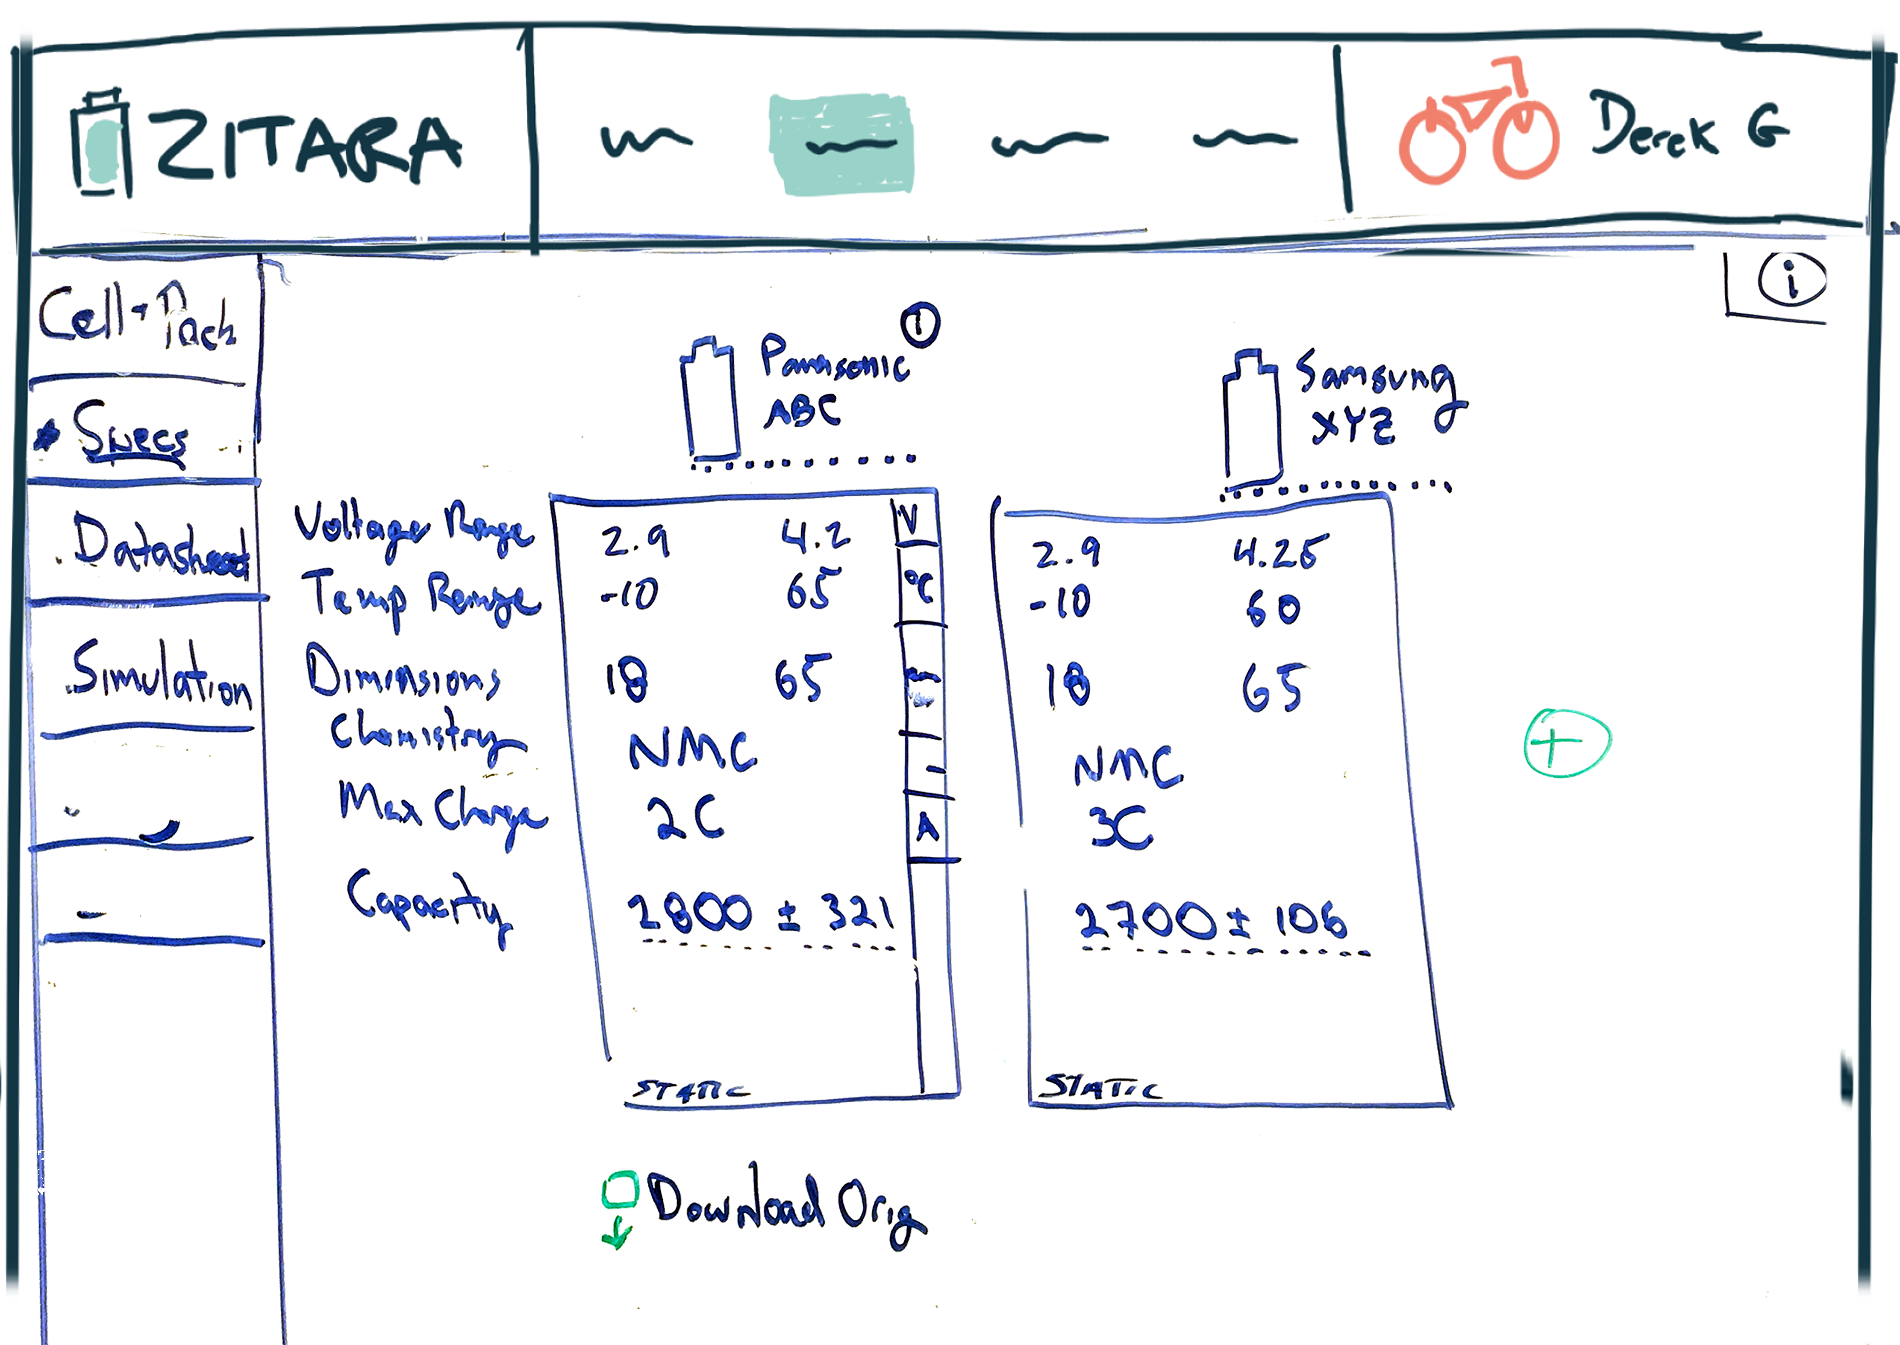
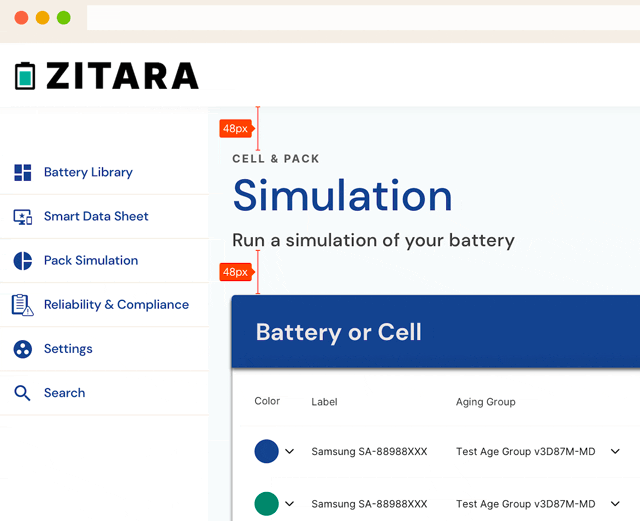
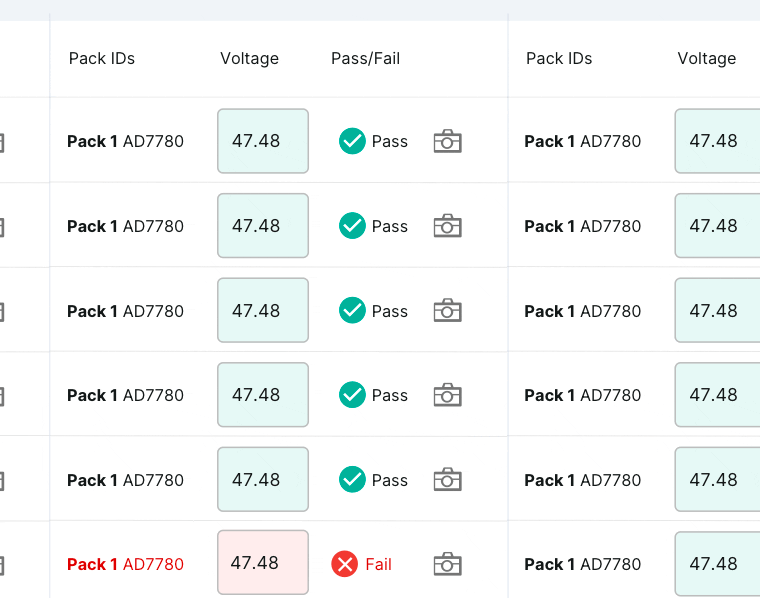
A web-based app for Predictive Battery Analytics. Designed to support flexible deployments precision battery algorithms using cloud APIs, standalone embedded implementations, or cloud-edge hybrid learning solutions.
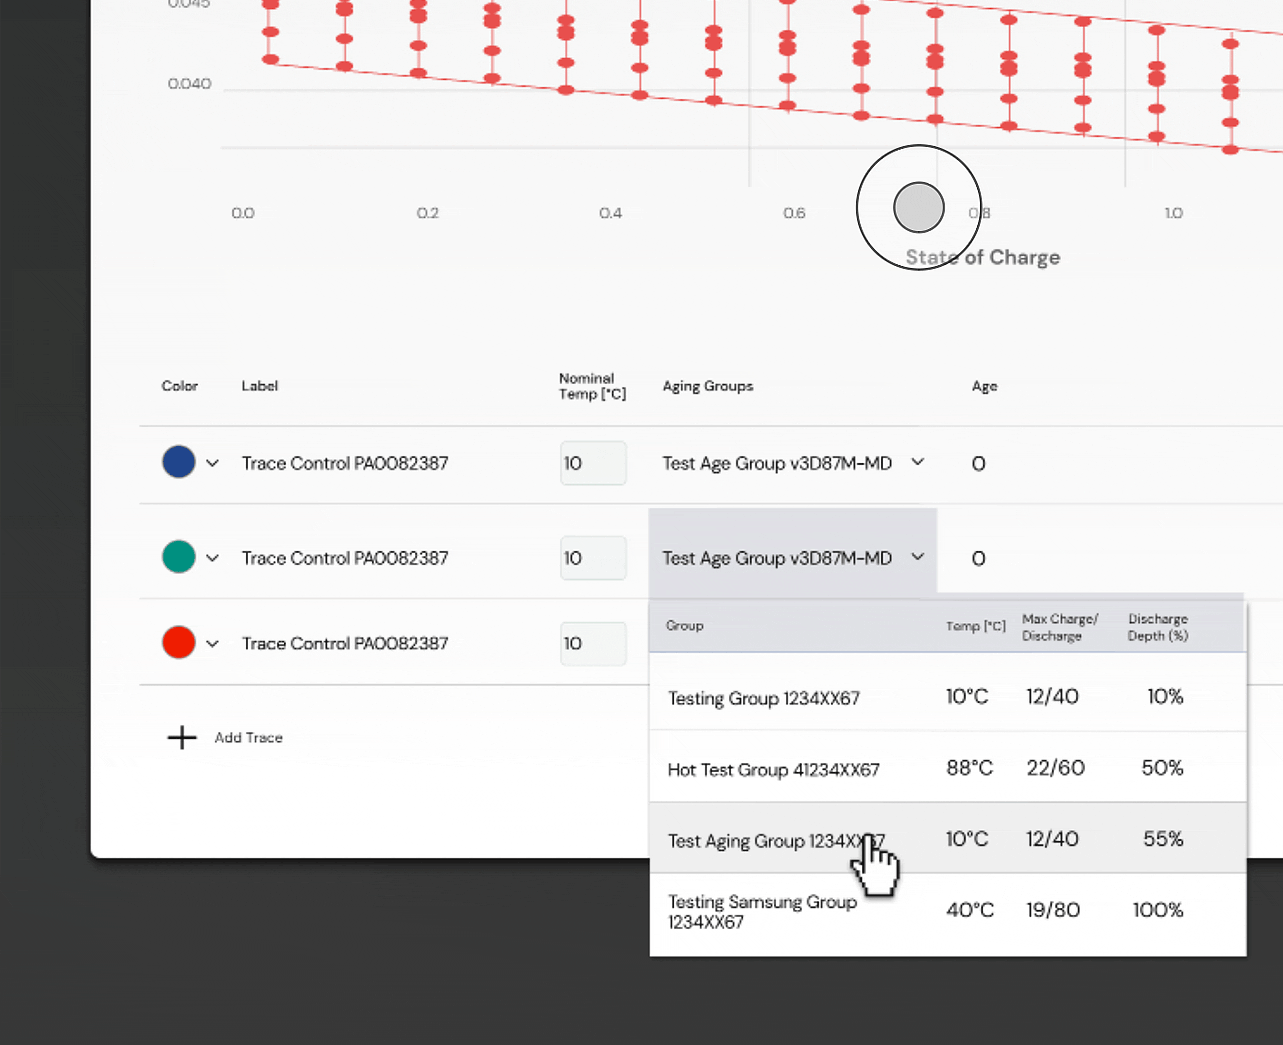
Algorithms and simulations are carefully validated for your cell chemistry and pack architecture using dynamic loads drawn from field use cases.
Algorithms and simulations are carefully validated for your cell chemistry and pack architecture using dynamic loads drawn from field use cases.
The Problem
Supply chains are stretched thin and often data sheets ignore time and temperature conditions. Static safety limits overlook anomalies that effect cell performance.
Market Opportunities
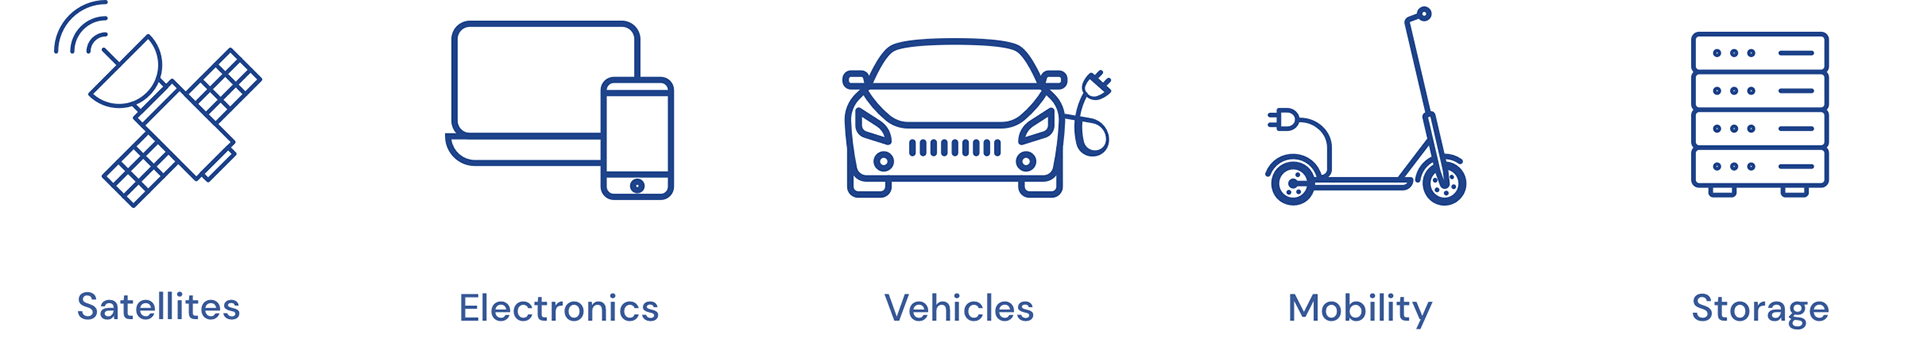
Customers across many booming industries need advanced physics and machine-learning powered battery management software they have engineered.

The Solution
The app was designed to support flexible deployments of our precision battery algorithms using cloud APIs, standalone embedded implementations, or cloud-edge hybrid learning solutions.
Algorithms and simulations are carefully validated for your cell chemistry and pack architecture using dynamic loads drawn from field use cases. Then the results are compiled into an intuitive interface and refined by battery scientists.
Discovery
The discovery phase a competitive analysis, user survey, interviews and analysis were created in order to create the most user-centric experience possible by getting well balanced data.
Competitive Analysis
A competitive analysis of major competitors was conducted to gain insight into their products, sales, and marketing tactics. Implementing stronger business strategies, warding off competitors, and capturing market share are just a few benefits of conducting a competitive market analysis.

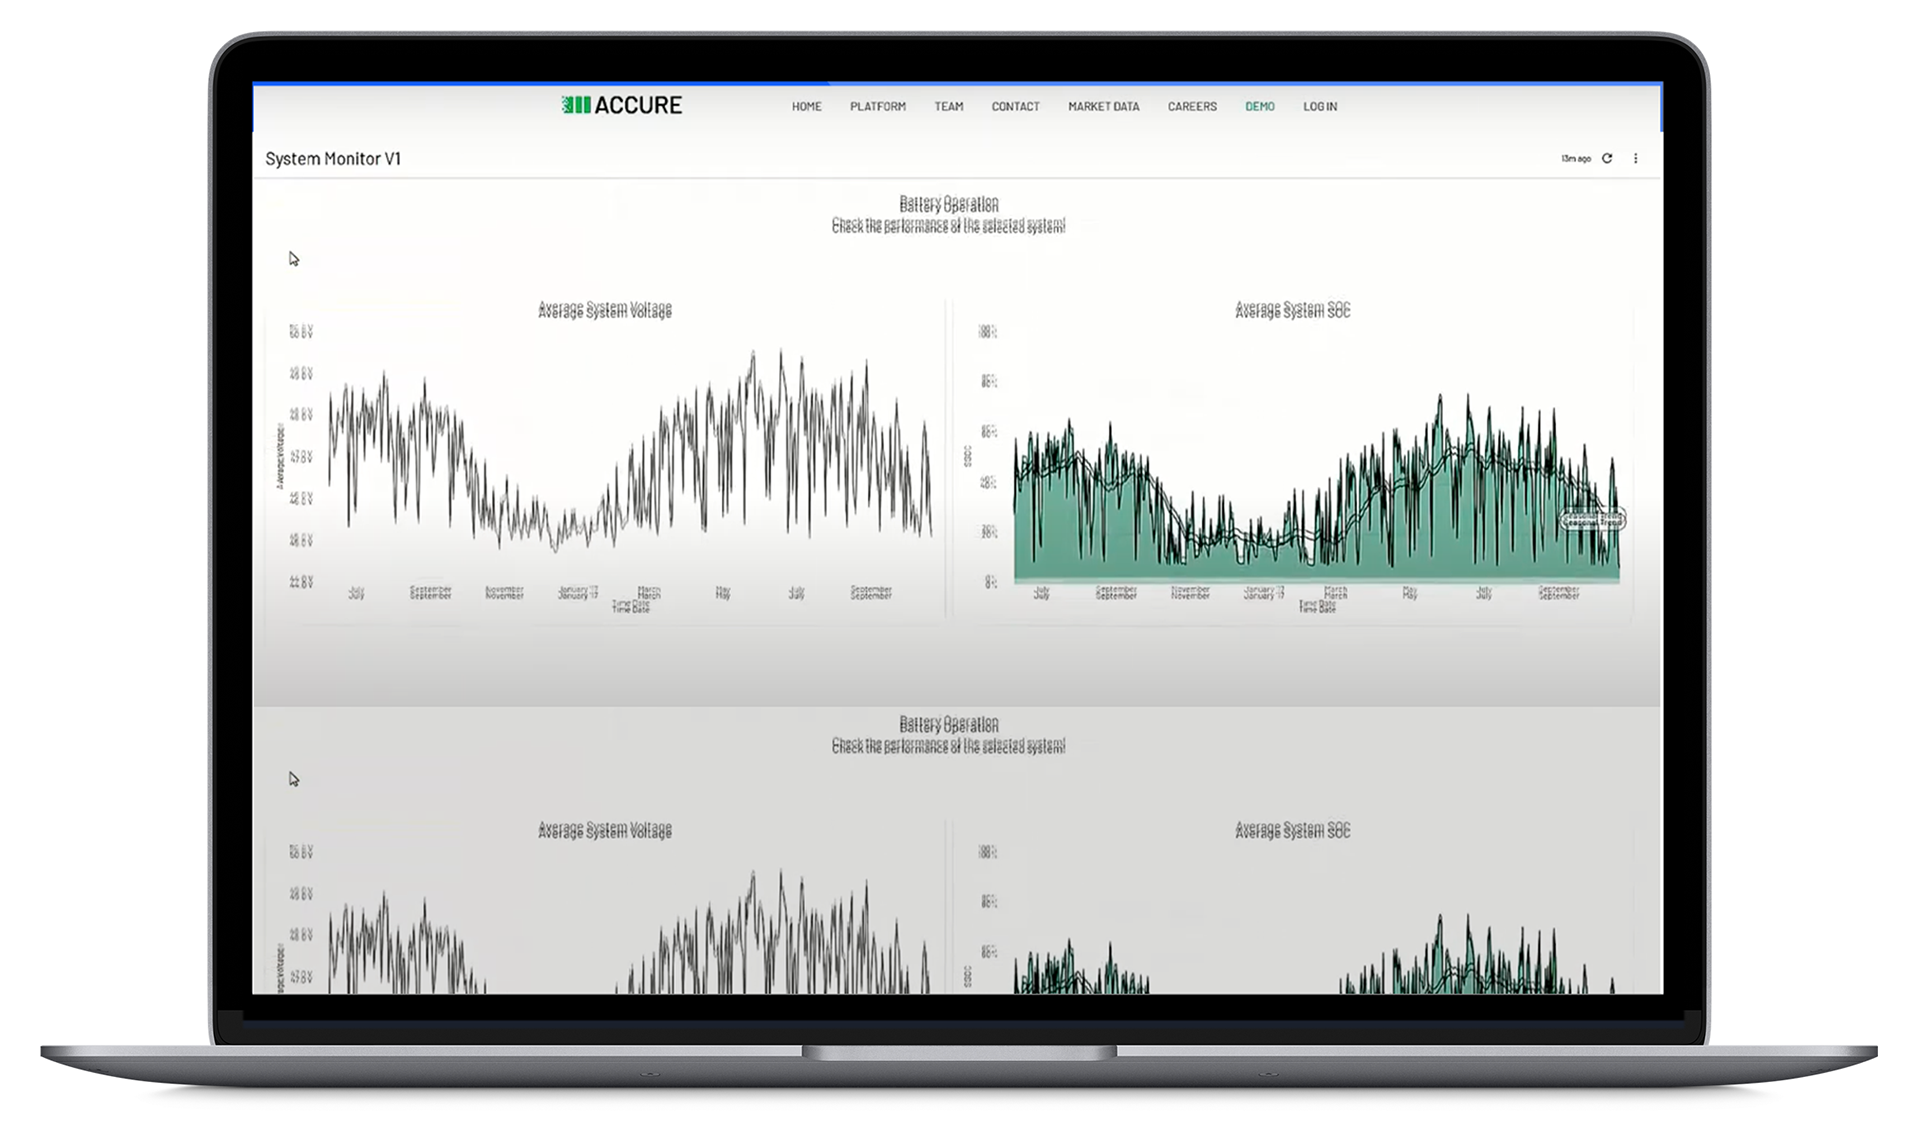
ACCURE allows companies in the energy and mobility sectors to predict safety incidents before they occur and optimize battery performance during operation without technical modifications. More than 220,000 battery systems – over 750 megawatt hours – worldwide are managed by the platform.
Strengths
• Heads-up dashboard of data
• Large graphics and charts
• Ability to see full data charts
Weaknesses
• Not able to run simulation
• Too much information for some
• Confusing data features

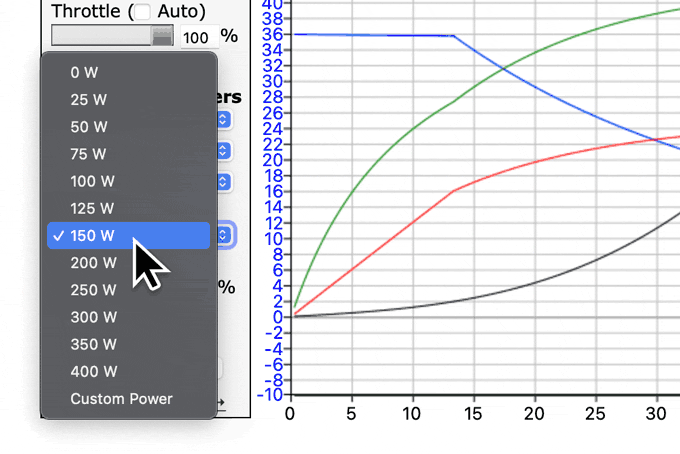
Using the Grin Tech online eBike simulator from the drop-down menu one of our modeled hub motors, the battery pack, wheel size, and motor controller current limit. Then hit "Simulate" and select your bicycle model and weight. The application will then display graphs versus your speed.
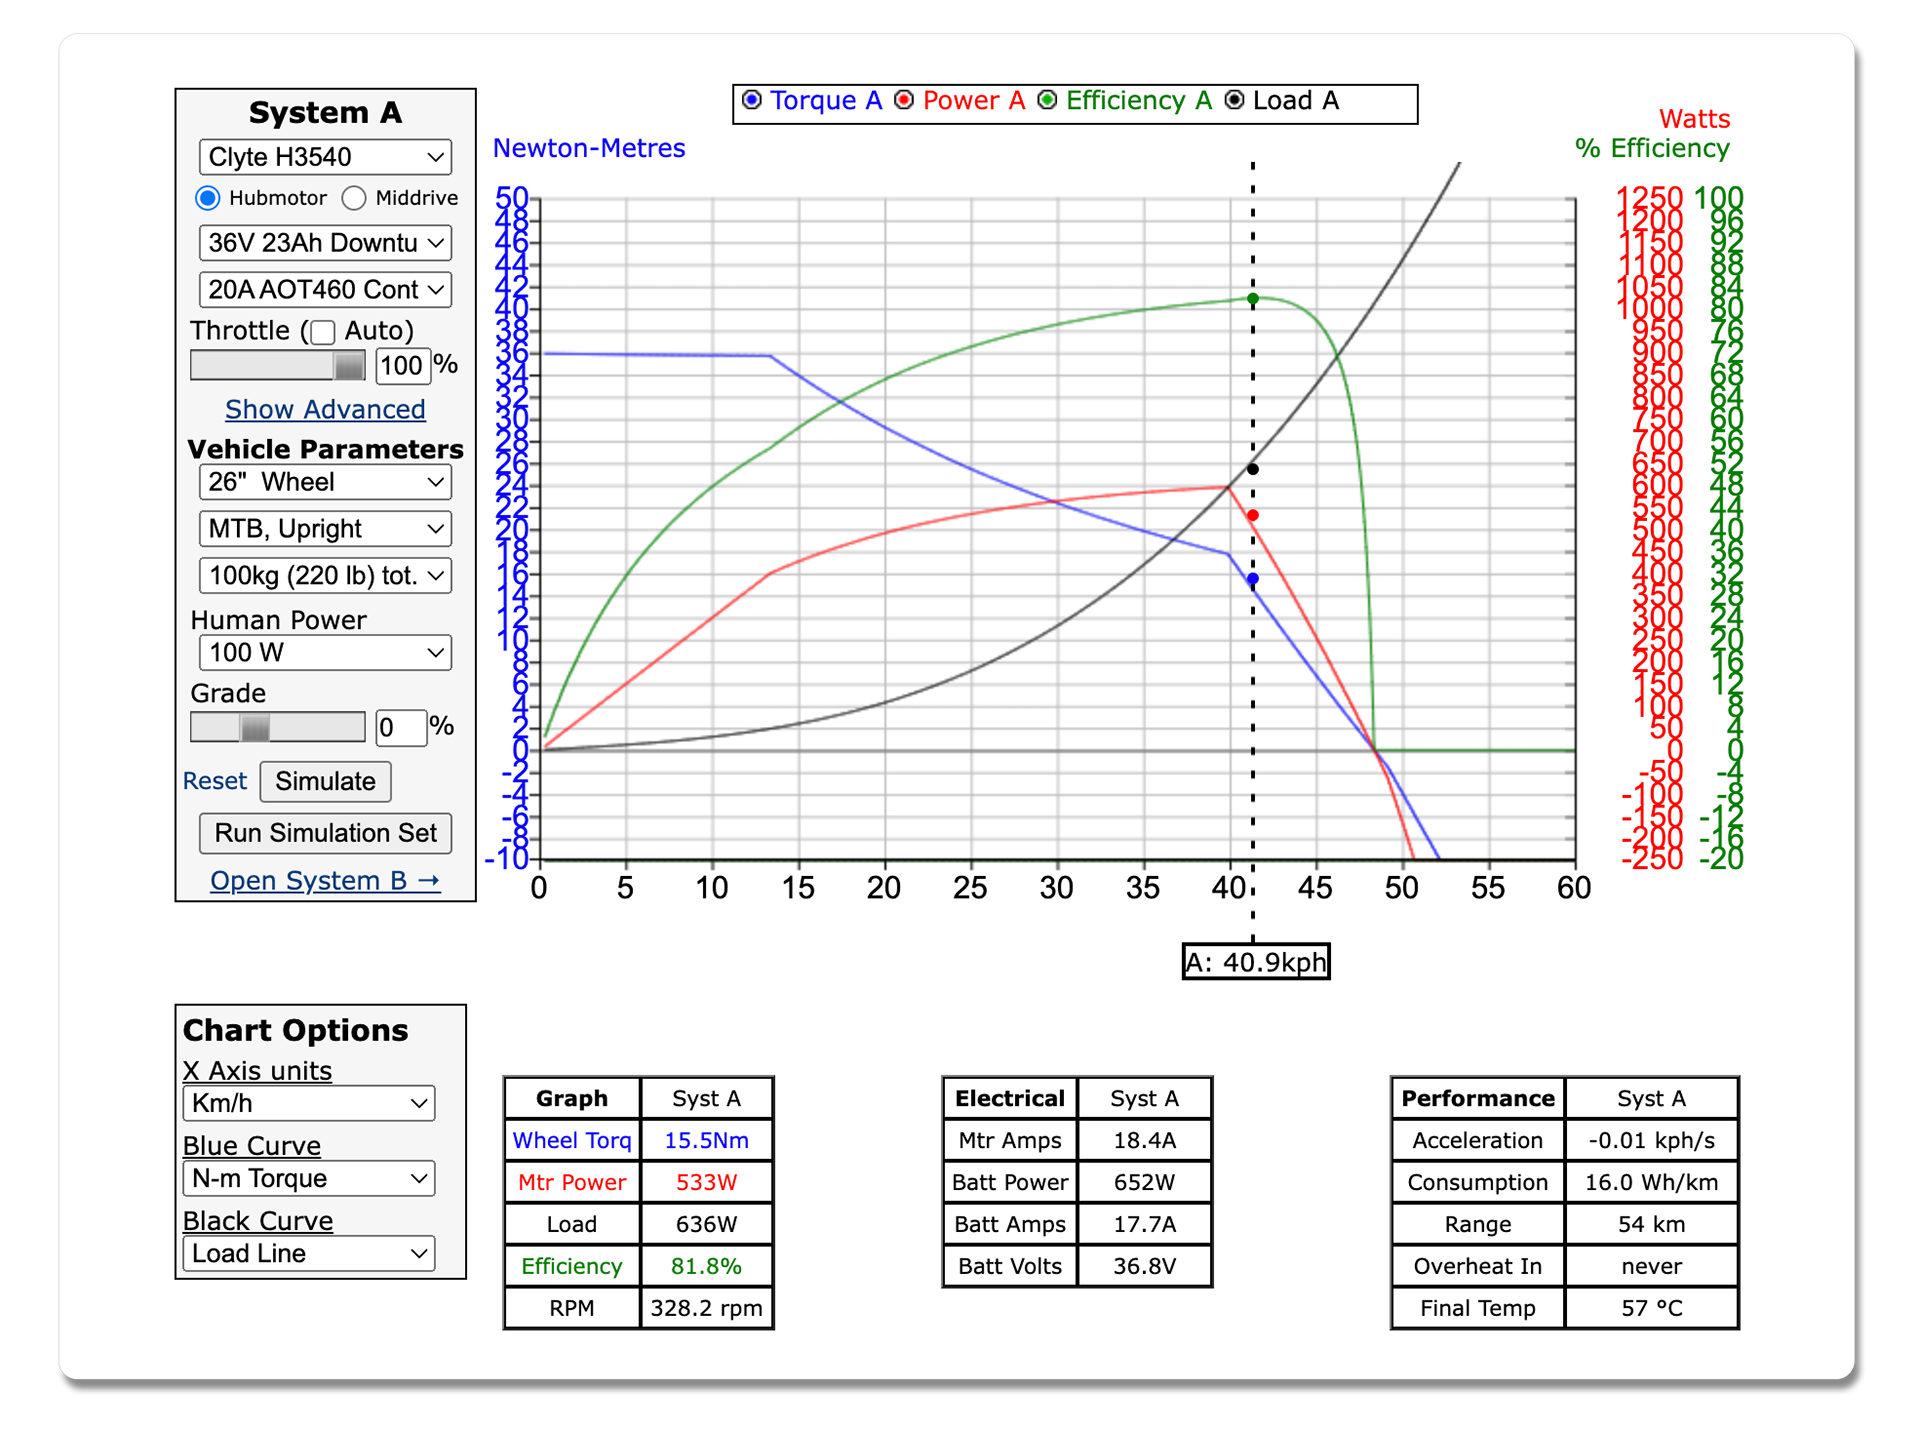
Strengths
• Good UI elements and Iconography
• Ability to edit parameters
• Ability to see full data charts
Weaknesses
• Challenging to navigate application
• Too much information for some
• Confusing data features

Bosch has a pretty extensive range calculator where you are able to change all sorts of variables, from rider weight, terrain, type of bike, tires, etc. Understandably, this calculator is limited to the Bosch line of products but has some helpful information.

Strengths
• Fun and engaging
• Real-time feedback
• Navigation was easy and intuitive
Weaknesses
• Limited to the Bosch line
• Not a profesional tool
• No ability to see data saved
Users & Audience
To learn more about the audience, a survey was conducted via Google Forms. This included procedures, pain points, priorities and perspectives on current tools available to scientistes for analytical cell testing. The surveys were followed up by a user interviews, conducted over video.
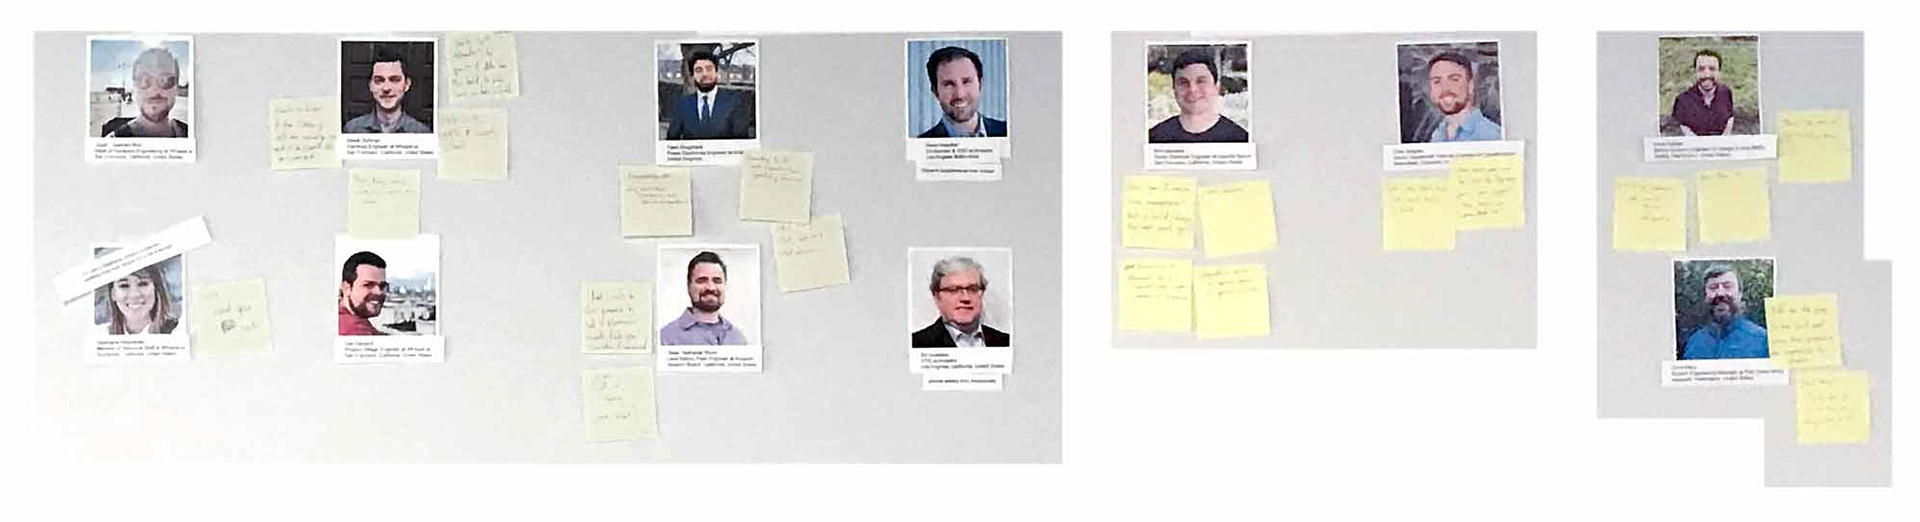
User Interviews
A round of user interviews were performed by a variety of users in order to further gain some qualitative insights direct and in their own words. Below are some of the more prominent findings that were shared during the interviews.
A user-friendly interface
Prediction and detection of defects
Focus on new designs and BMS
Feels project under control
A dashboard that is easy to analyze
Reducing waste
Make informed decisions
Help in imaging SLA
Certify support tasks
Simulation API bug resolution
Pack Modeling
SoX Look ahead
SoH estimation
Age and performance data
Major safety factors
Vendor selection and supply chain
Verify constant power
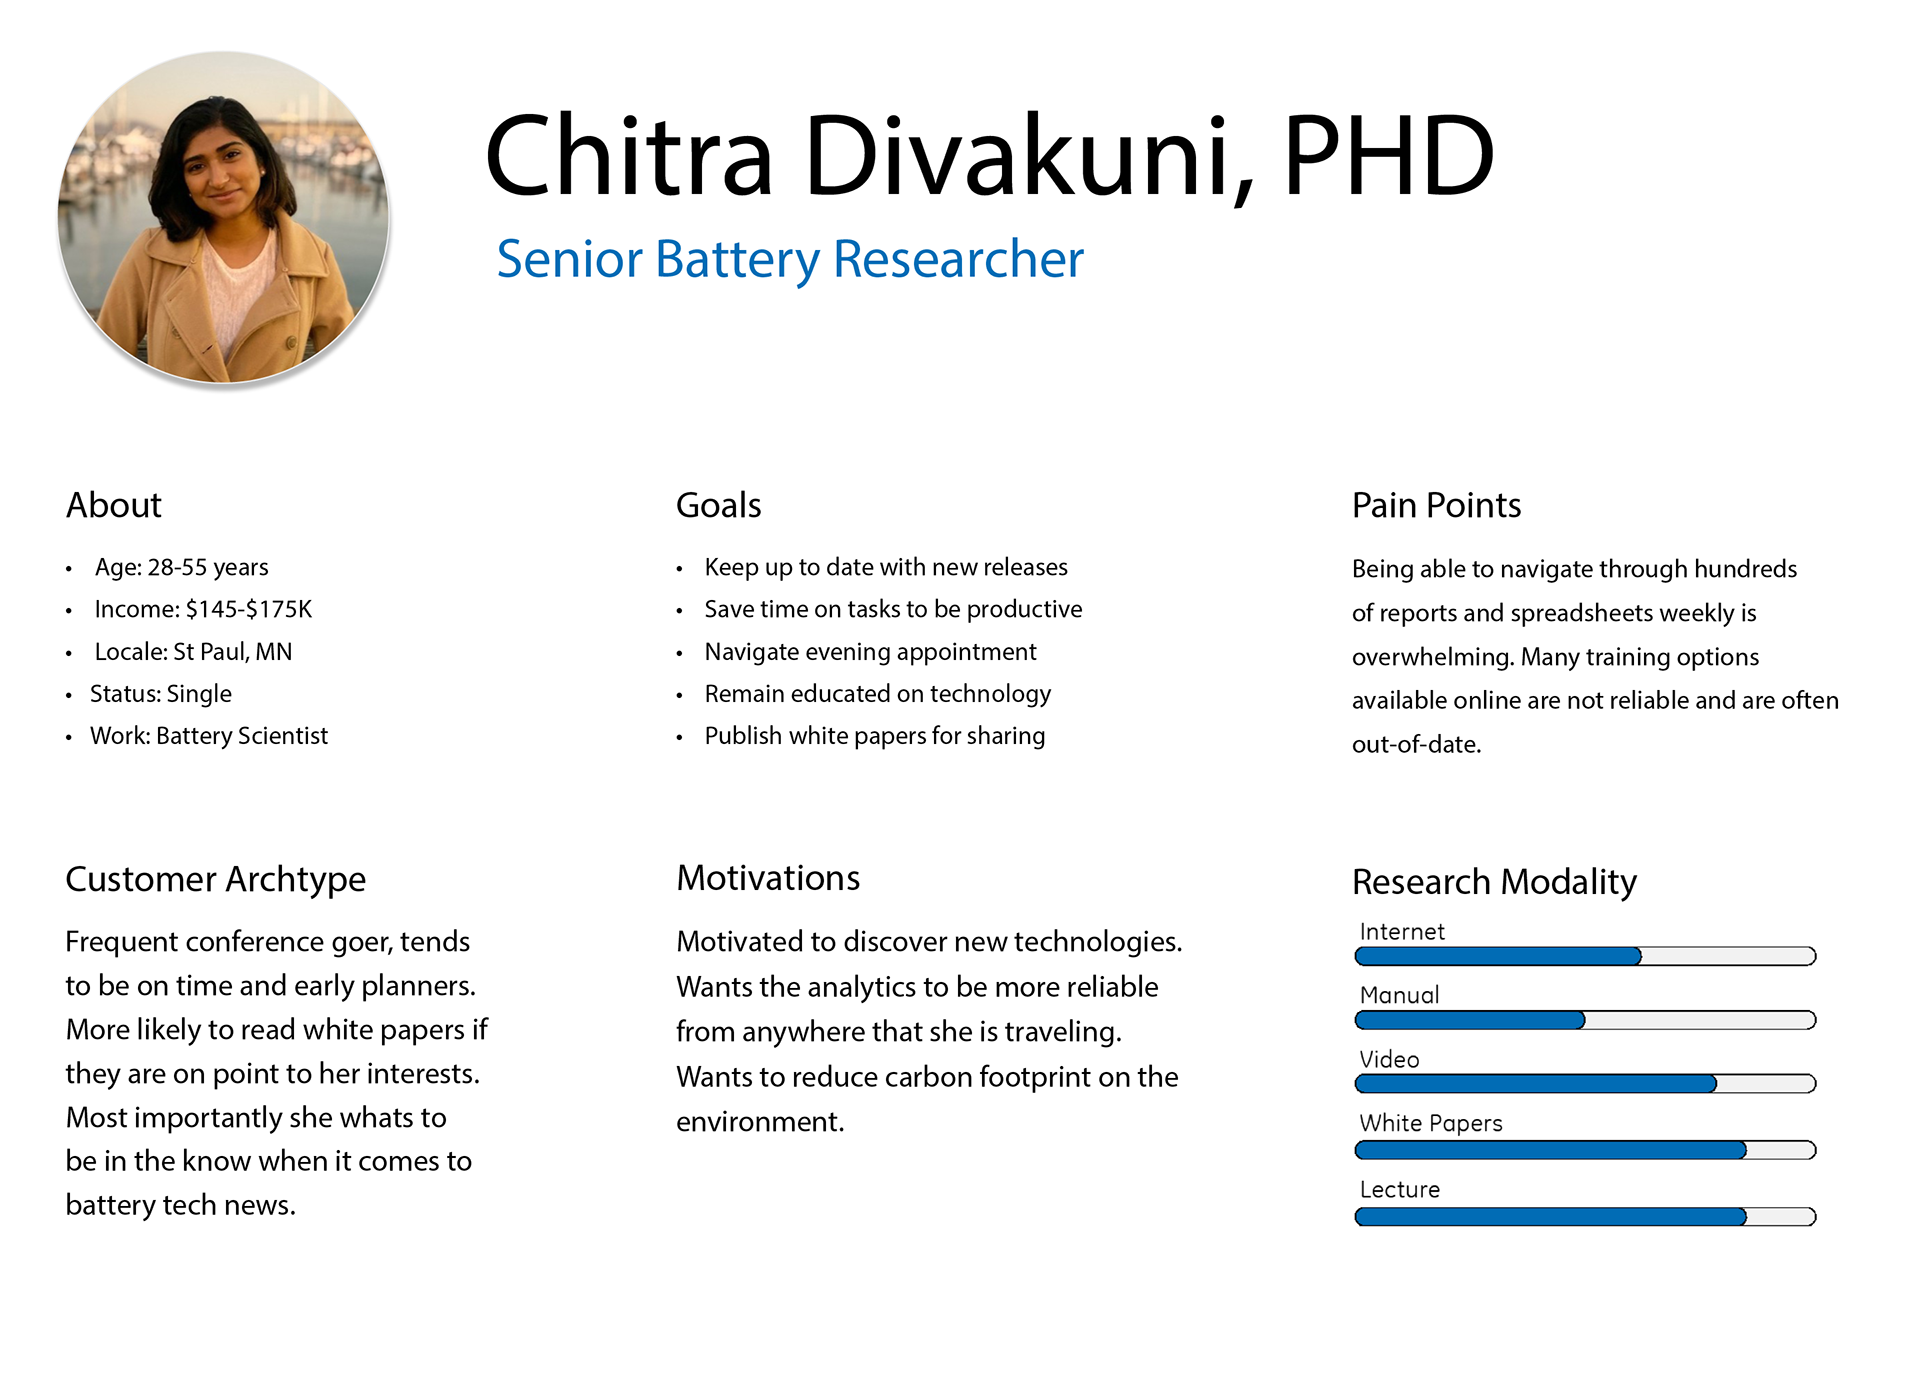
Personas
A few personas were created around target consumers to model our user stories into any challenges unique to researching battery cells.
Creating Storyboards
Creating a few storyboards helped to identify the process more thoroughly. The following is on such example.

Vendor sells the electrical engineer a battery. Salesman claims it to last 22hrs on a single charge.
The vendor makes great batteries but they are only lasting 10hrs. What if the user could find out more about why they are failing and find batteries that will not fail.
User fills out a questionaire and sends the battery to test in a box to Zitara.
A short time later an email arrives with a link to the Zitara Spec and Comparison page. Here the user discovers data that was never before available.
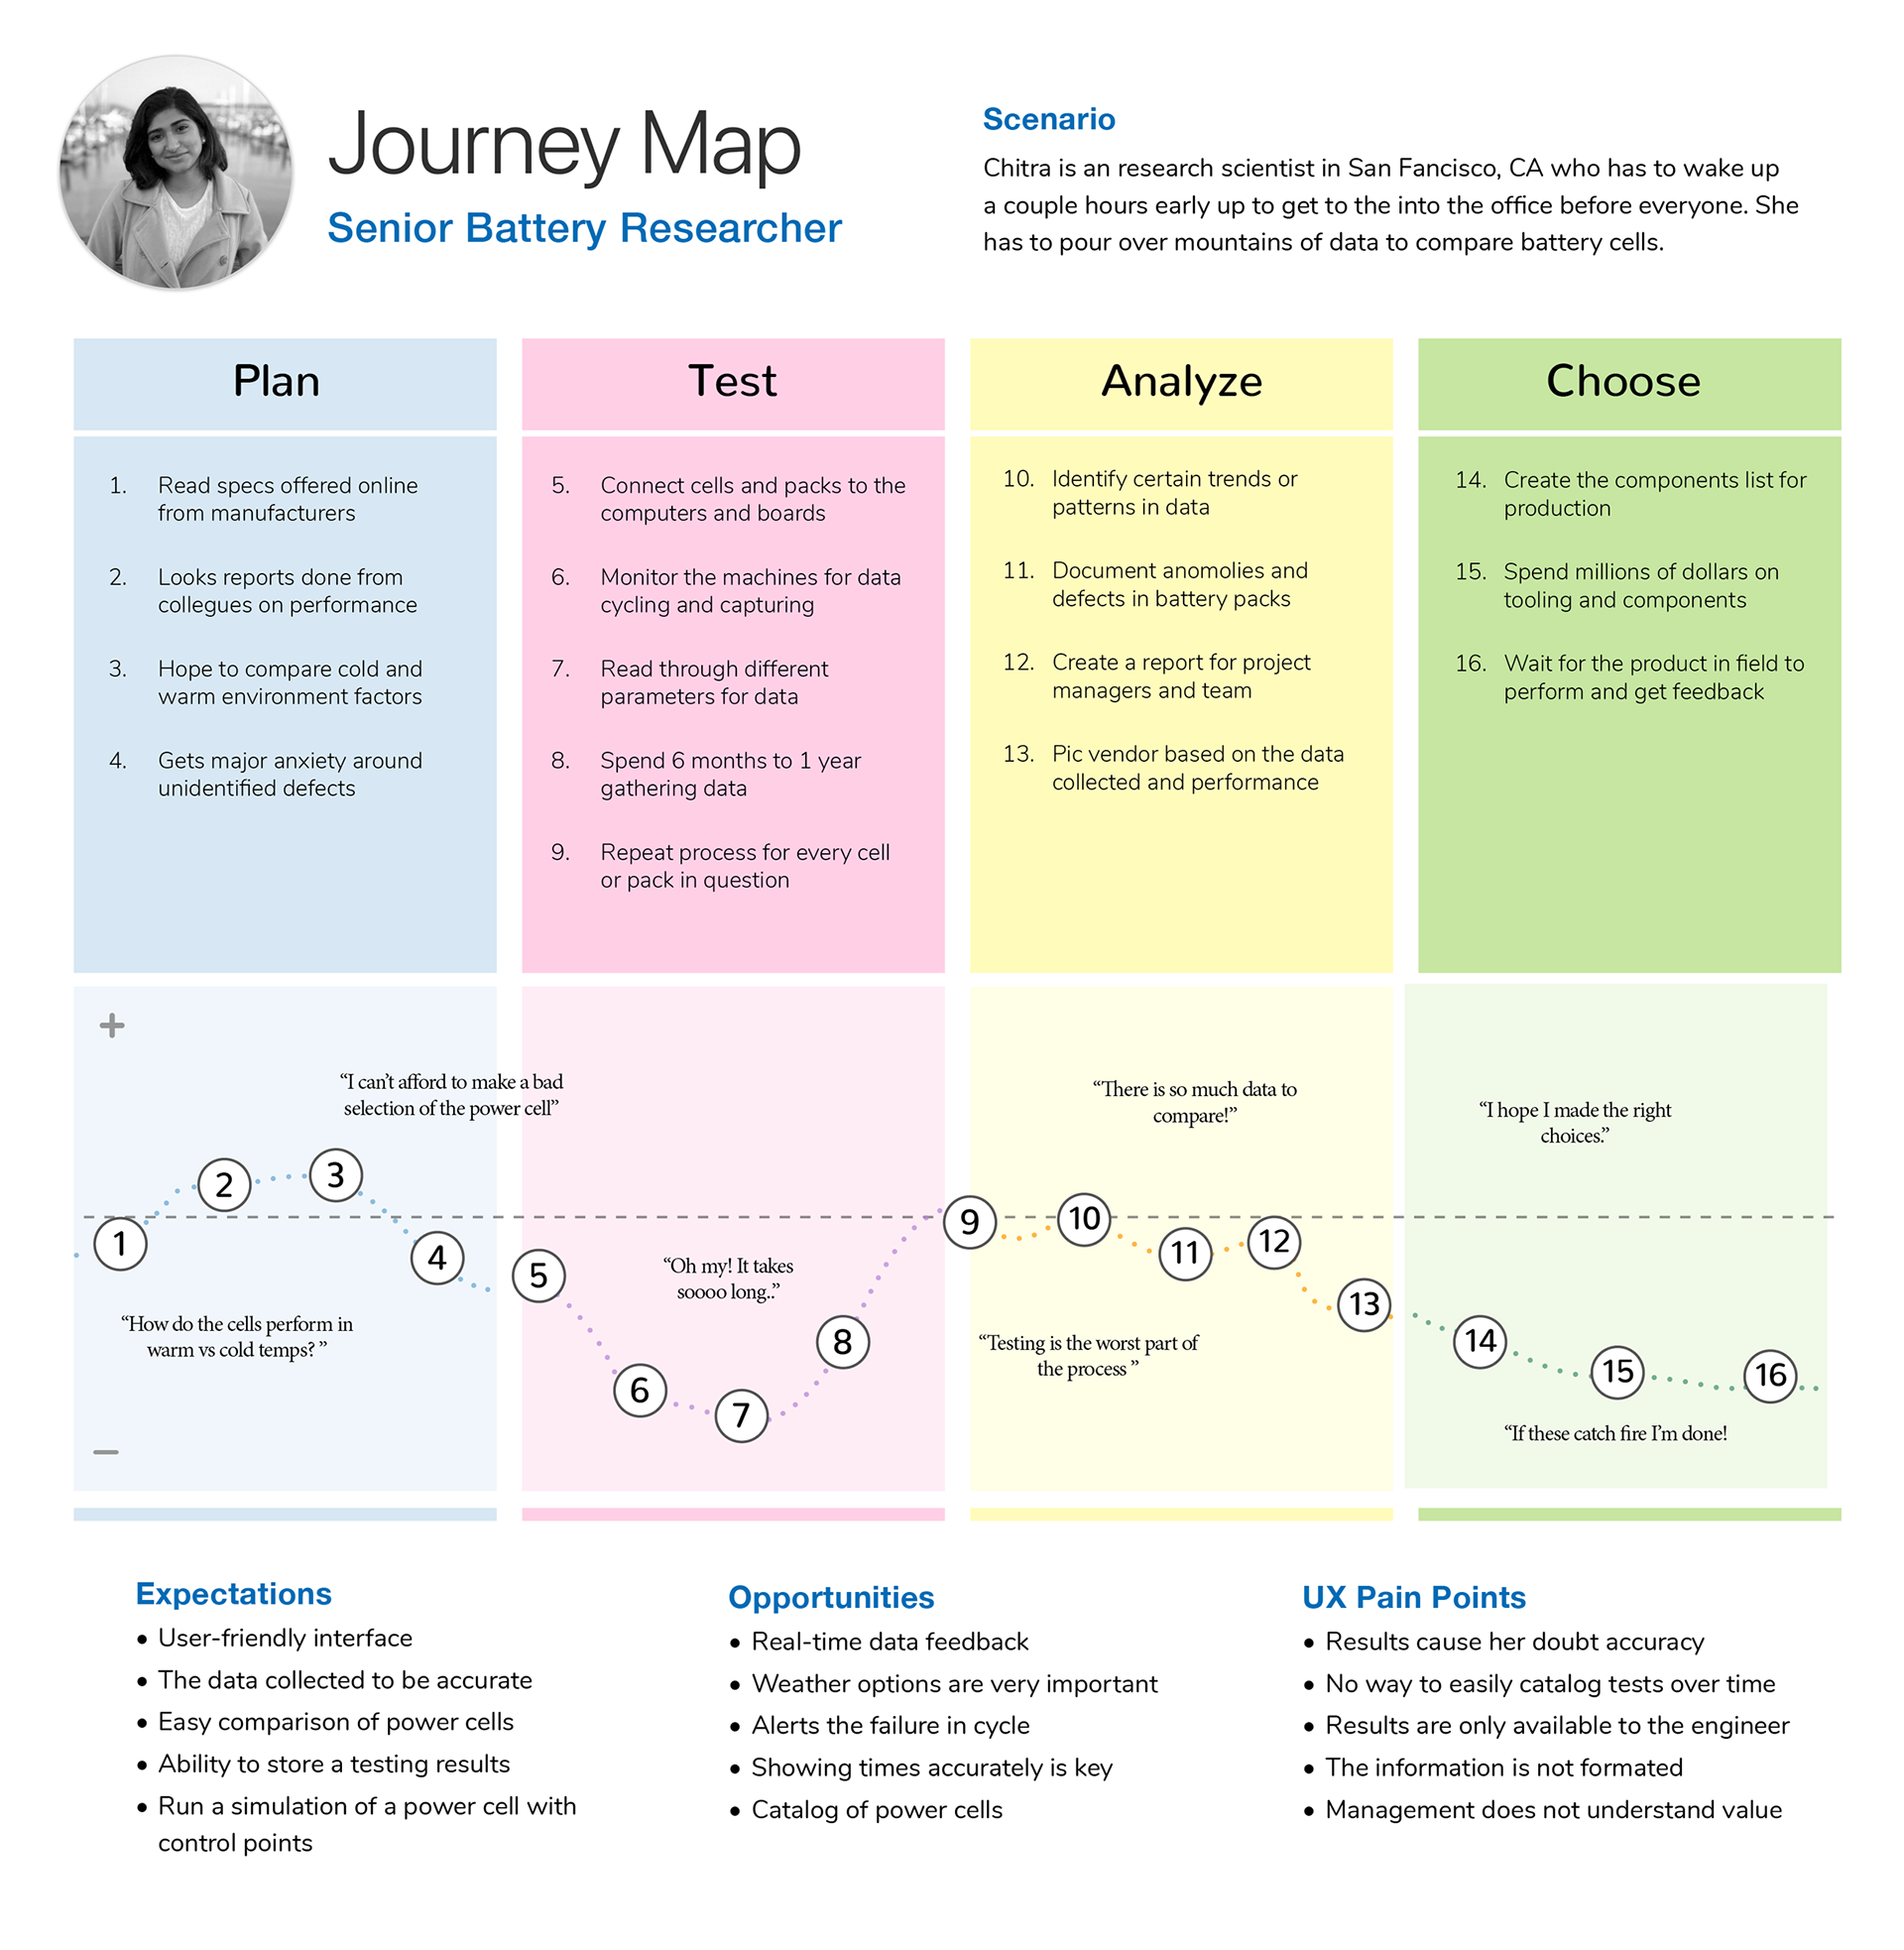
Journey Mapping
A journey map was developed as a visual representation of the scientists process. Helping to gain a deeper understanding of the experience across all phases of the journey.
Ideation
The goal of this design phase is to generate a large number of ideas — ideas that potentially inspire newer, better ideas — then refining them into the best, most practical and innovative ones.
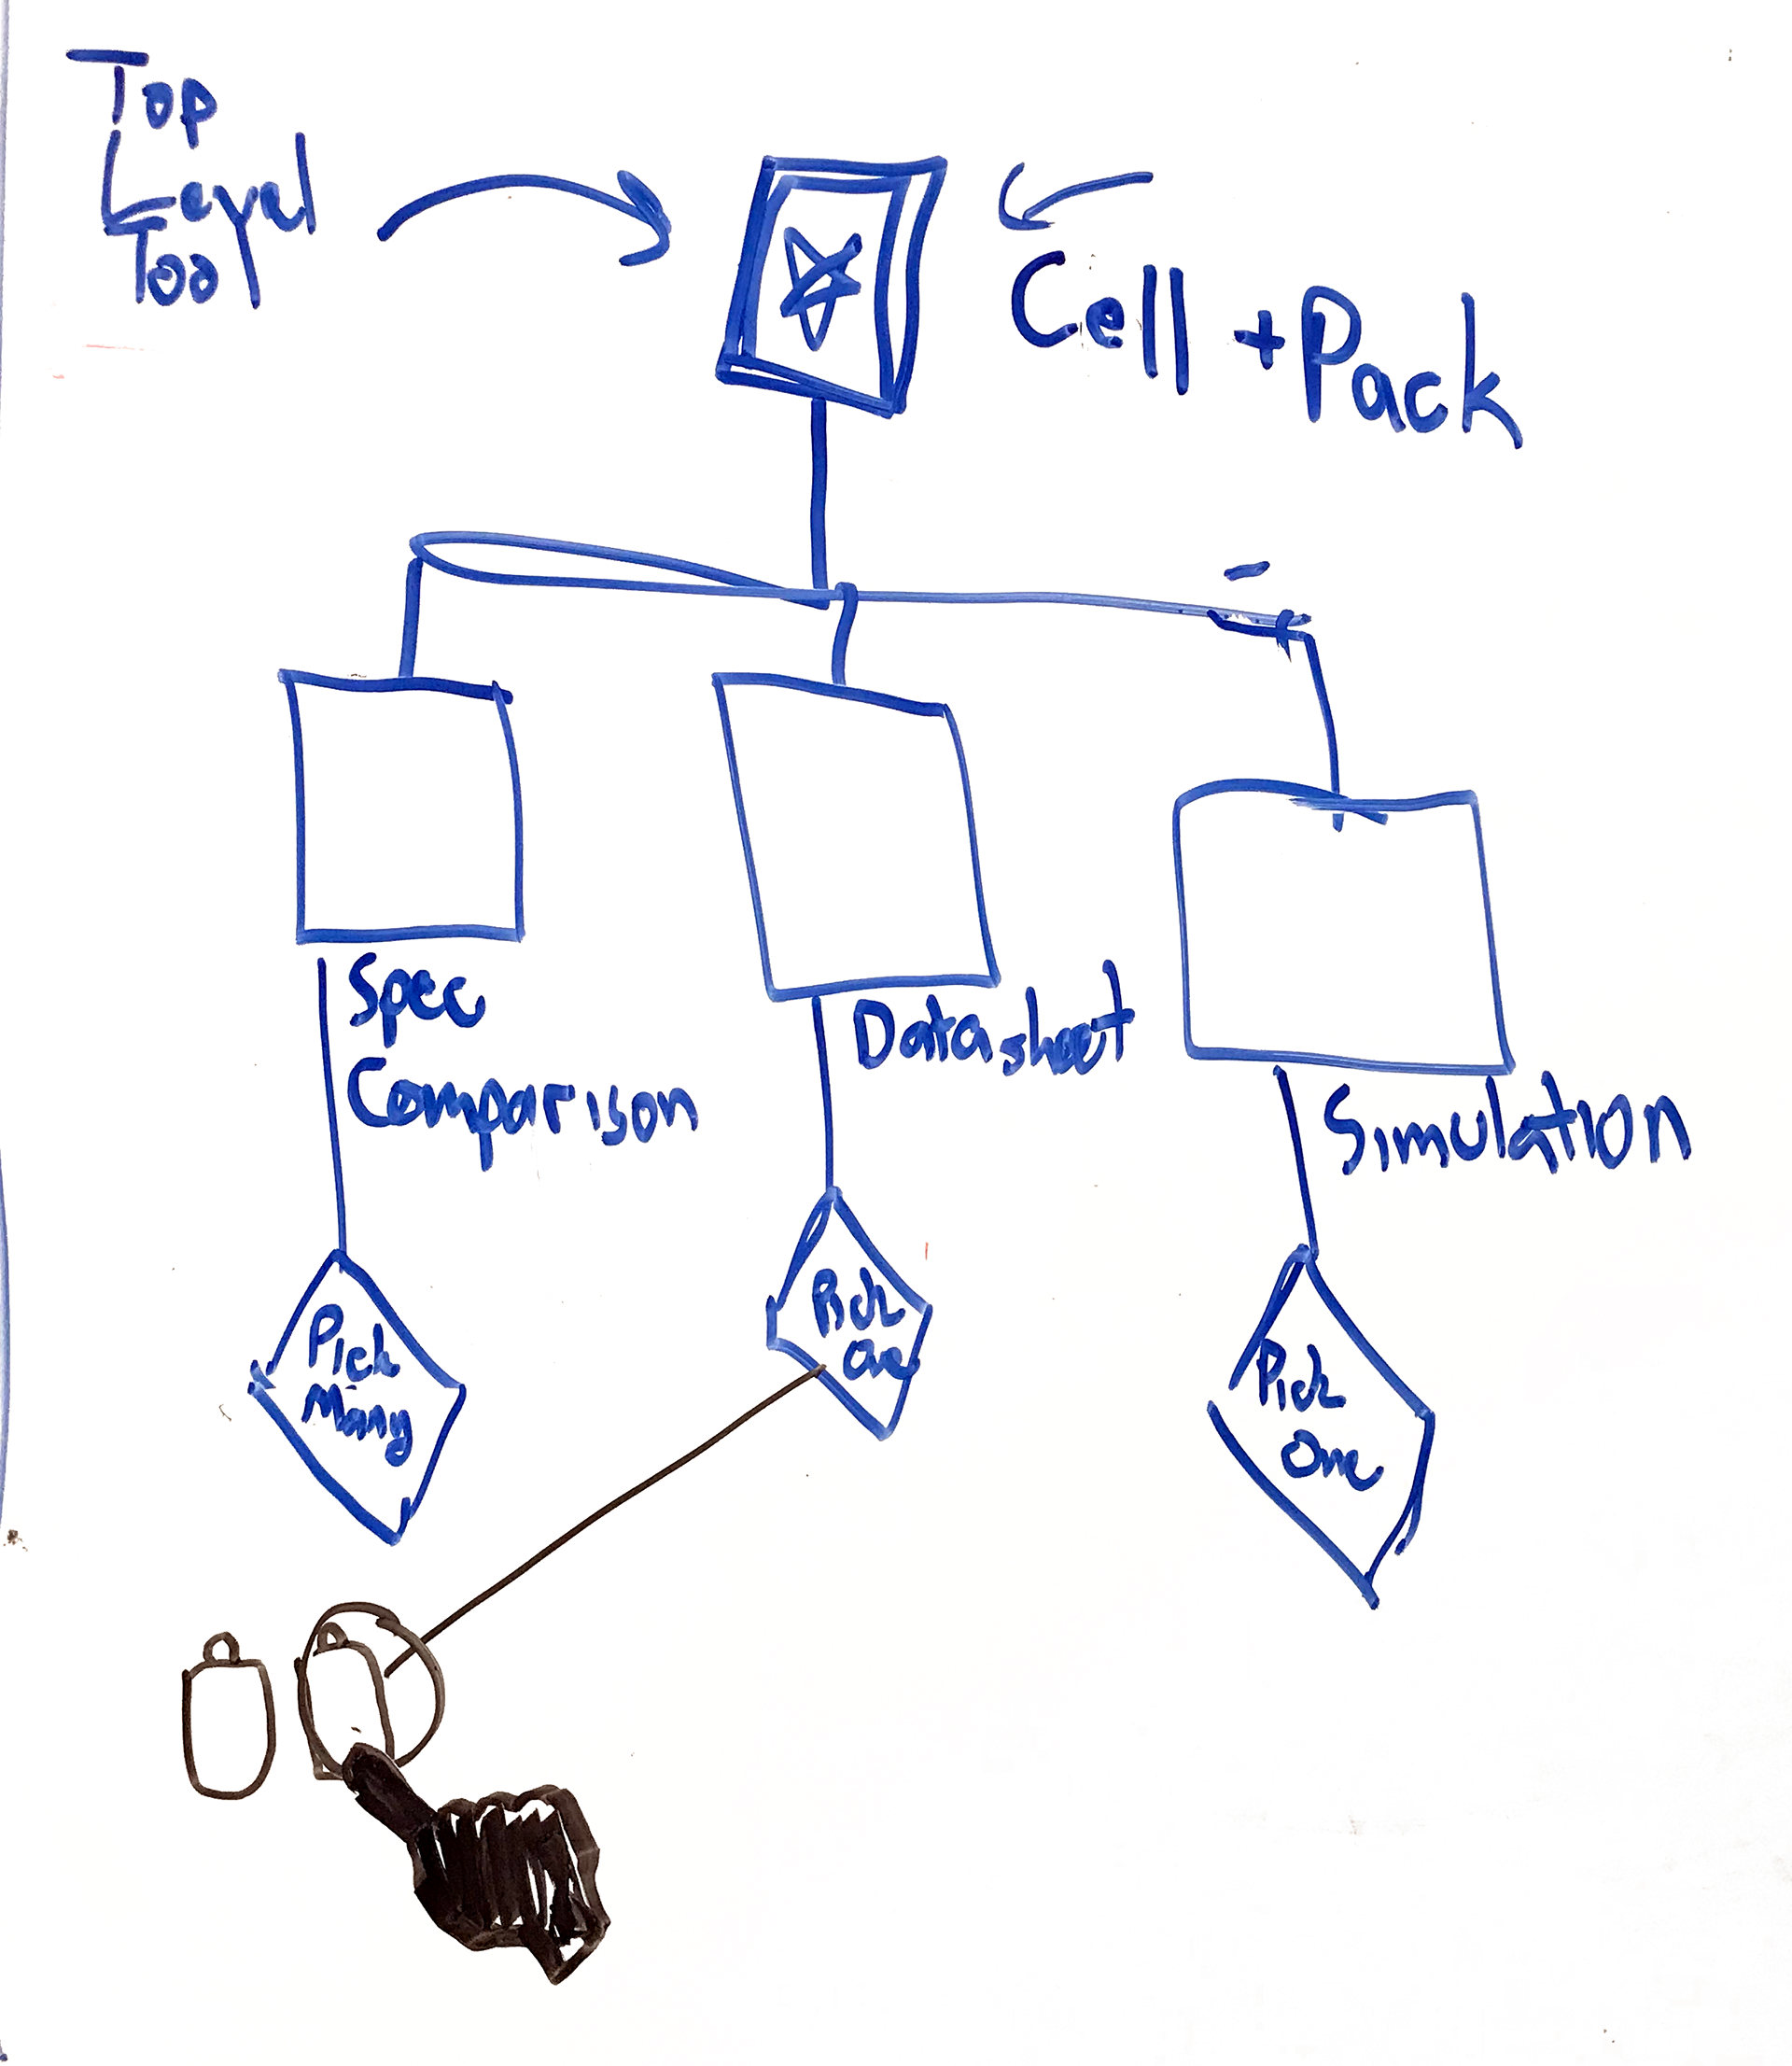
Site Map & User Flow
After creating a persona and the priorities for the user into a user story. It was time to begin ideating to towards the ideal path or a set of steps towards a successful outcome and final action.
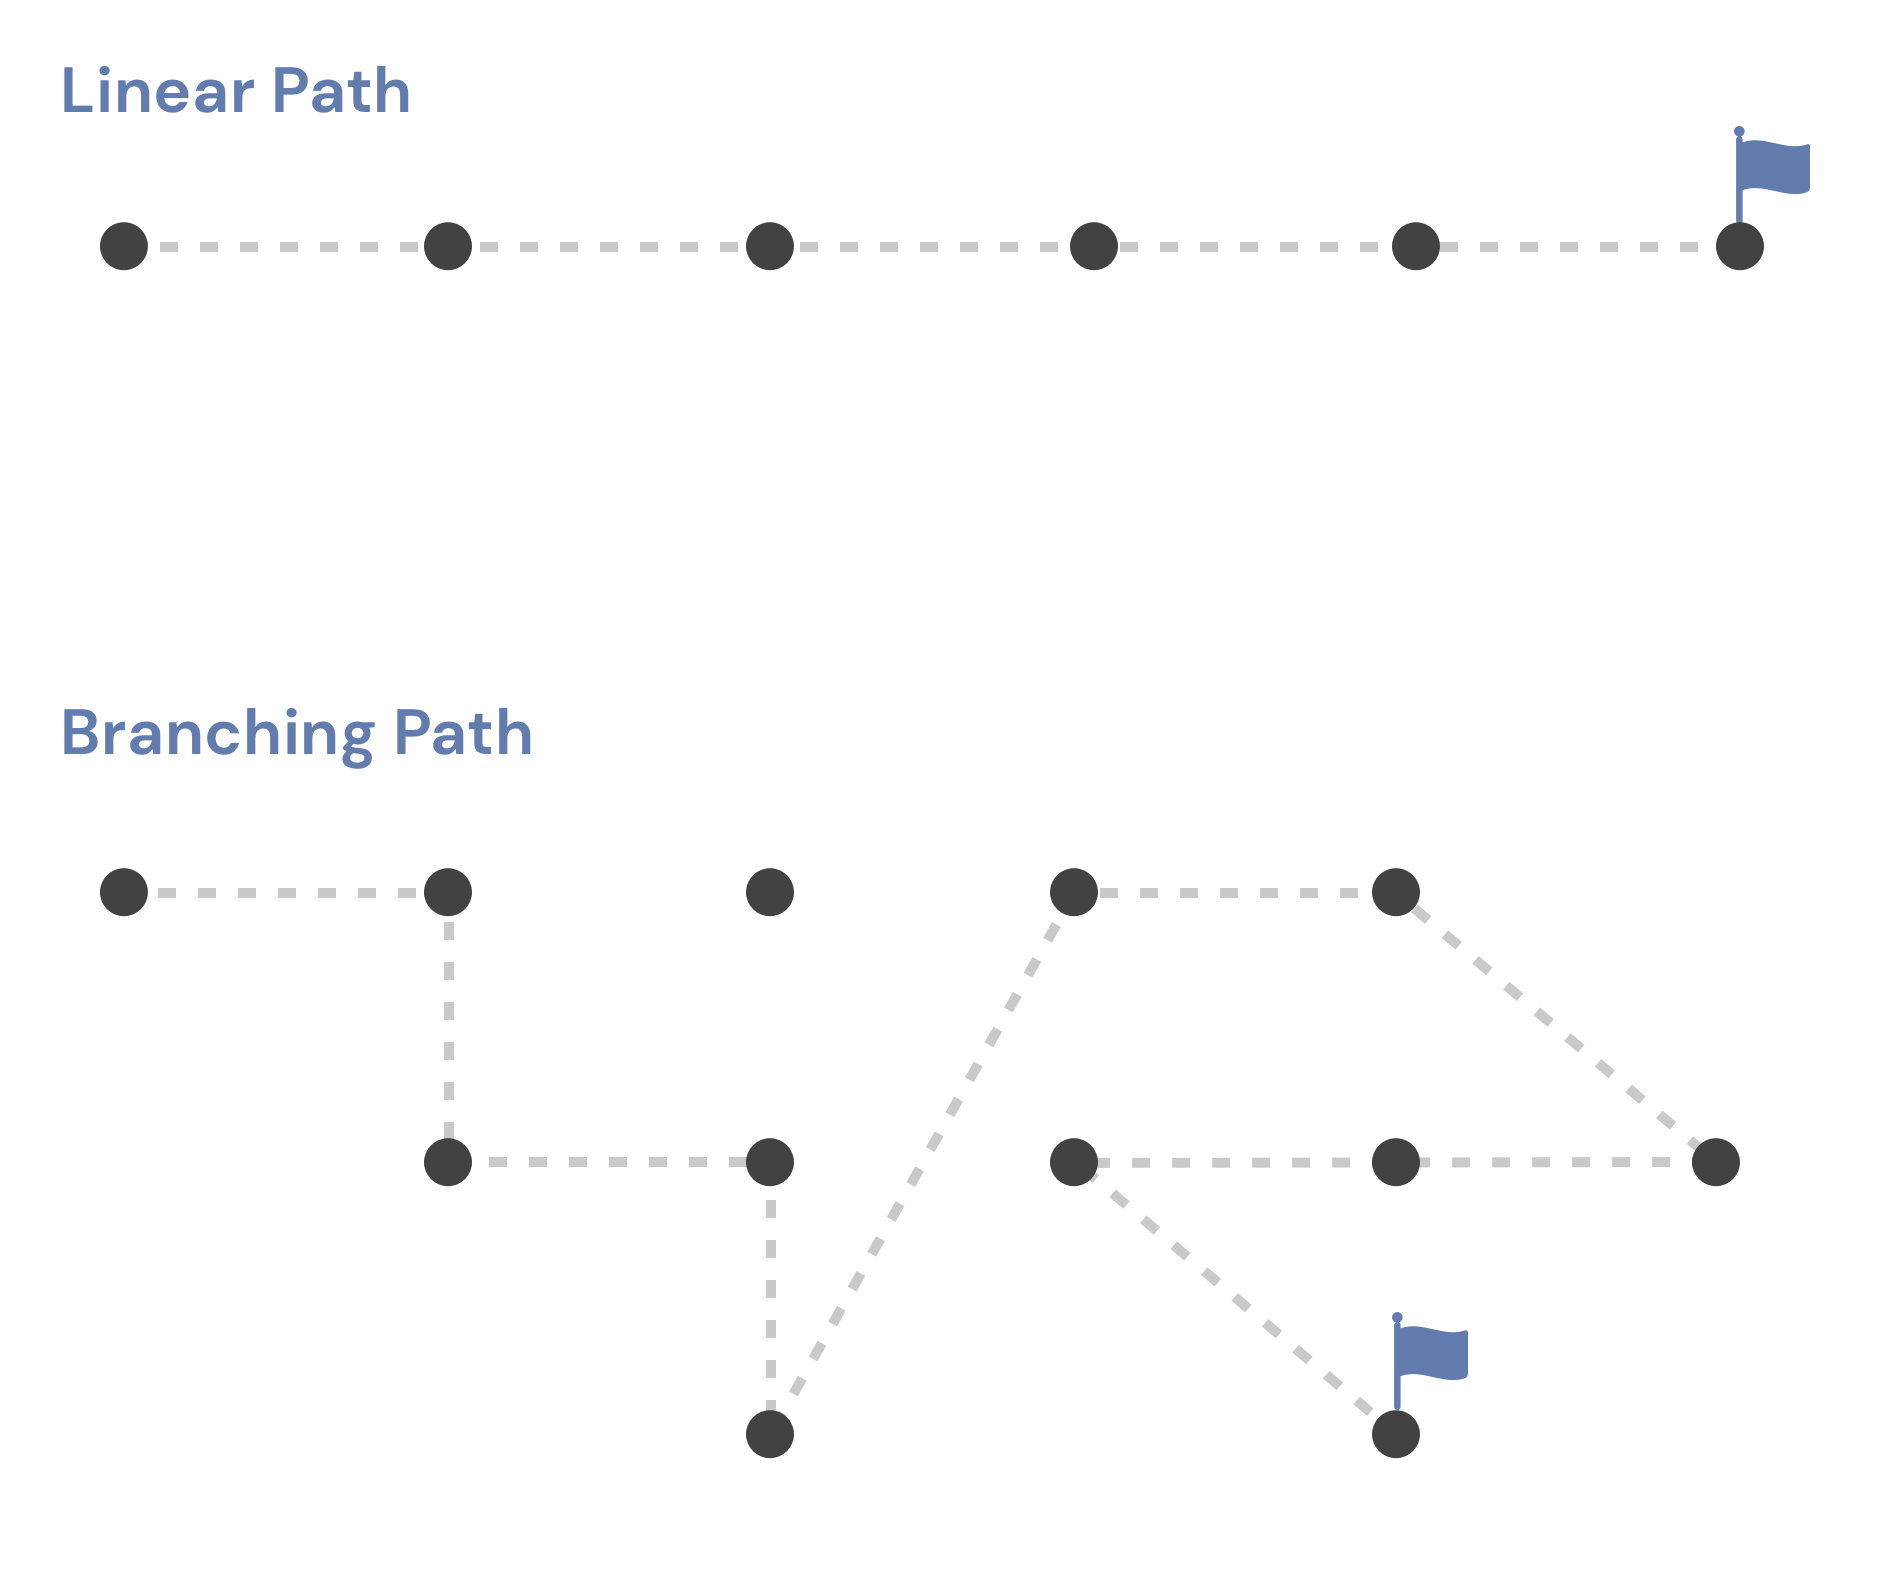
Linear vs. Branching Paths
The linear user-flow model breaks down for websites which are designed to offer data-driven insights.
Charts and graphs don't always reveal the full picture when it comes possibilities. To find the number of options, take number of charts and multiply it by the number of filters you have. Then multiply that by the number of sortable fields and/or toggles that you have available. It quickly turns into a maze of divergent paths.
Wireframes
A wireframe was generated from the results of interviews, surveys, and requirements. It was important to maintain an easy-to-use navigation.


Design Style Guide
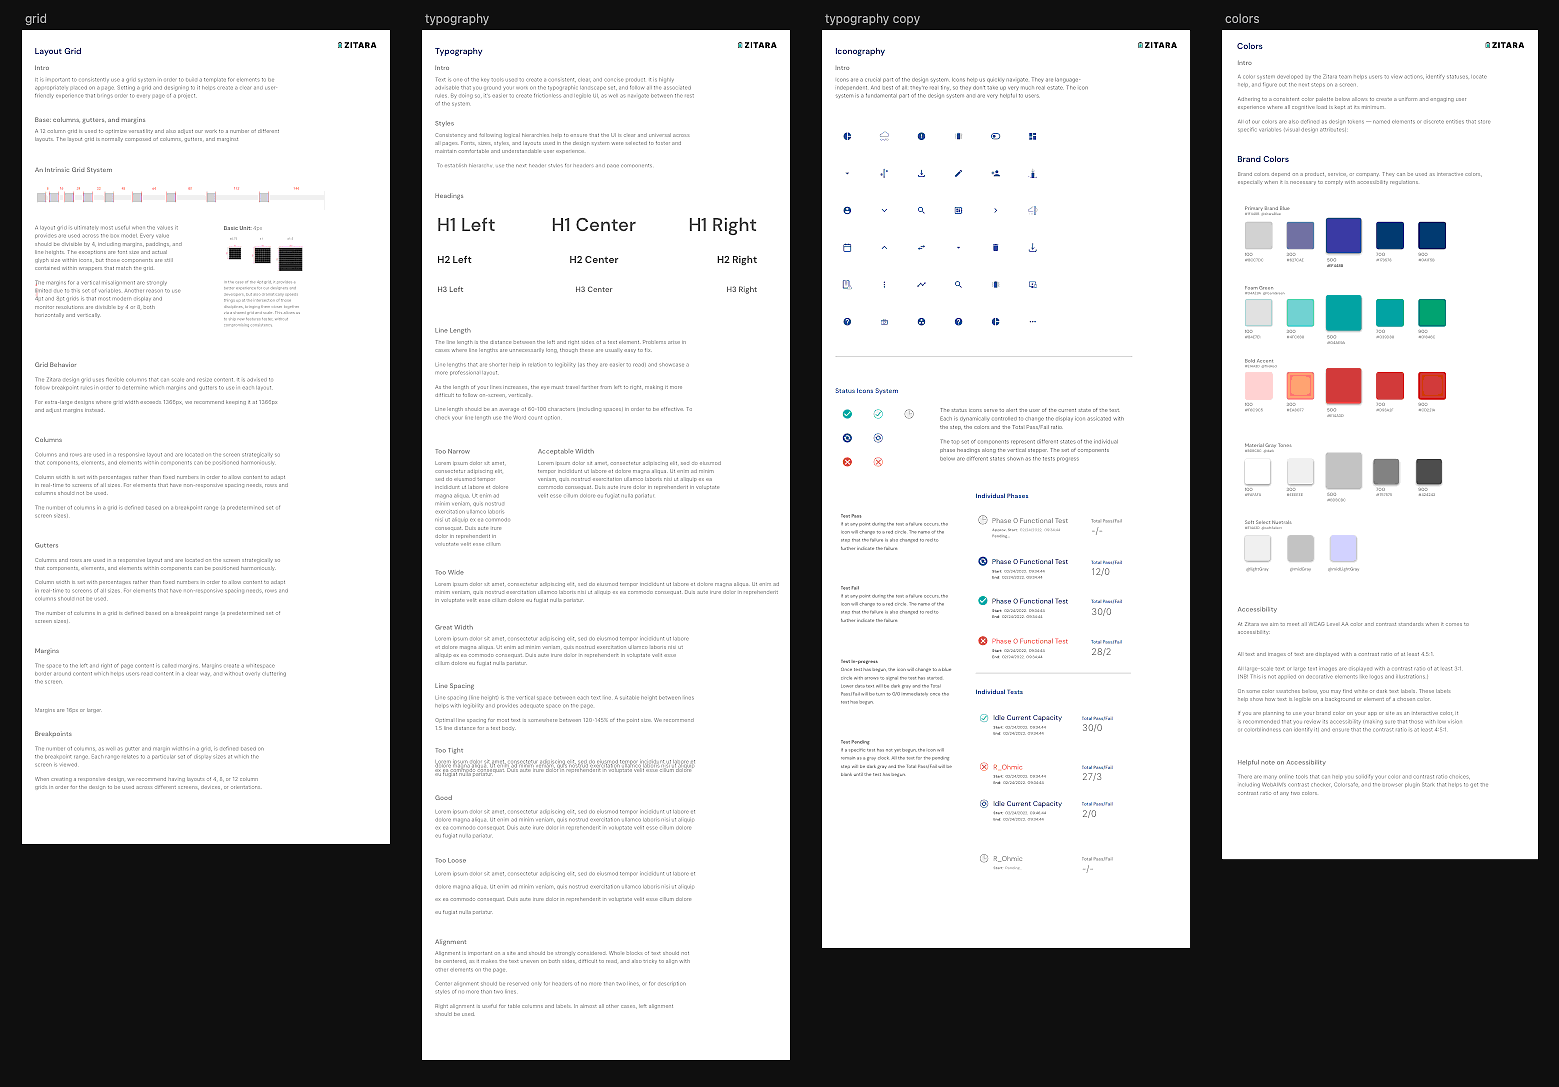
The design style guide standards define the company’s branding references grammar, tone, logo usage, colors, visuals, word usage, point of view, and more.
Having a clear brand style guide ensures that the app, and later on the website, material is consistent, polished, identifiable, relevant and engaging.
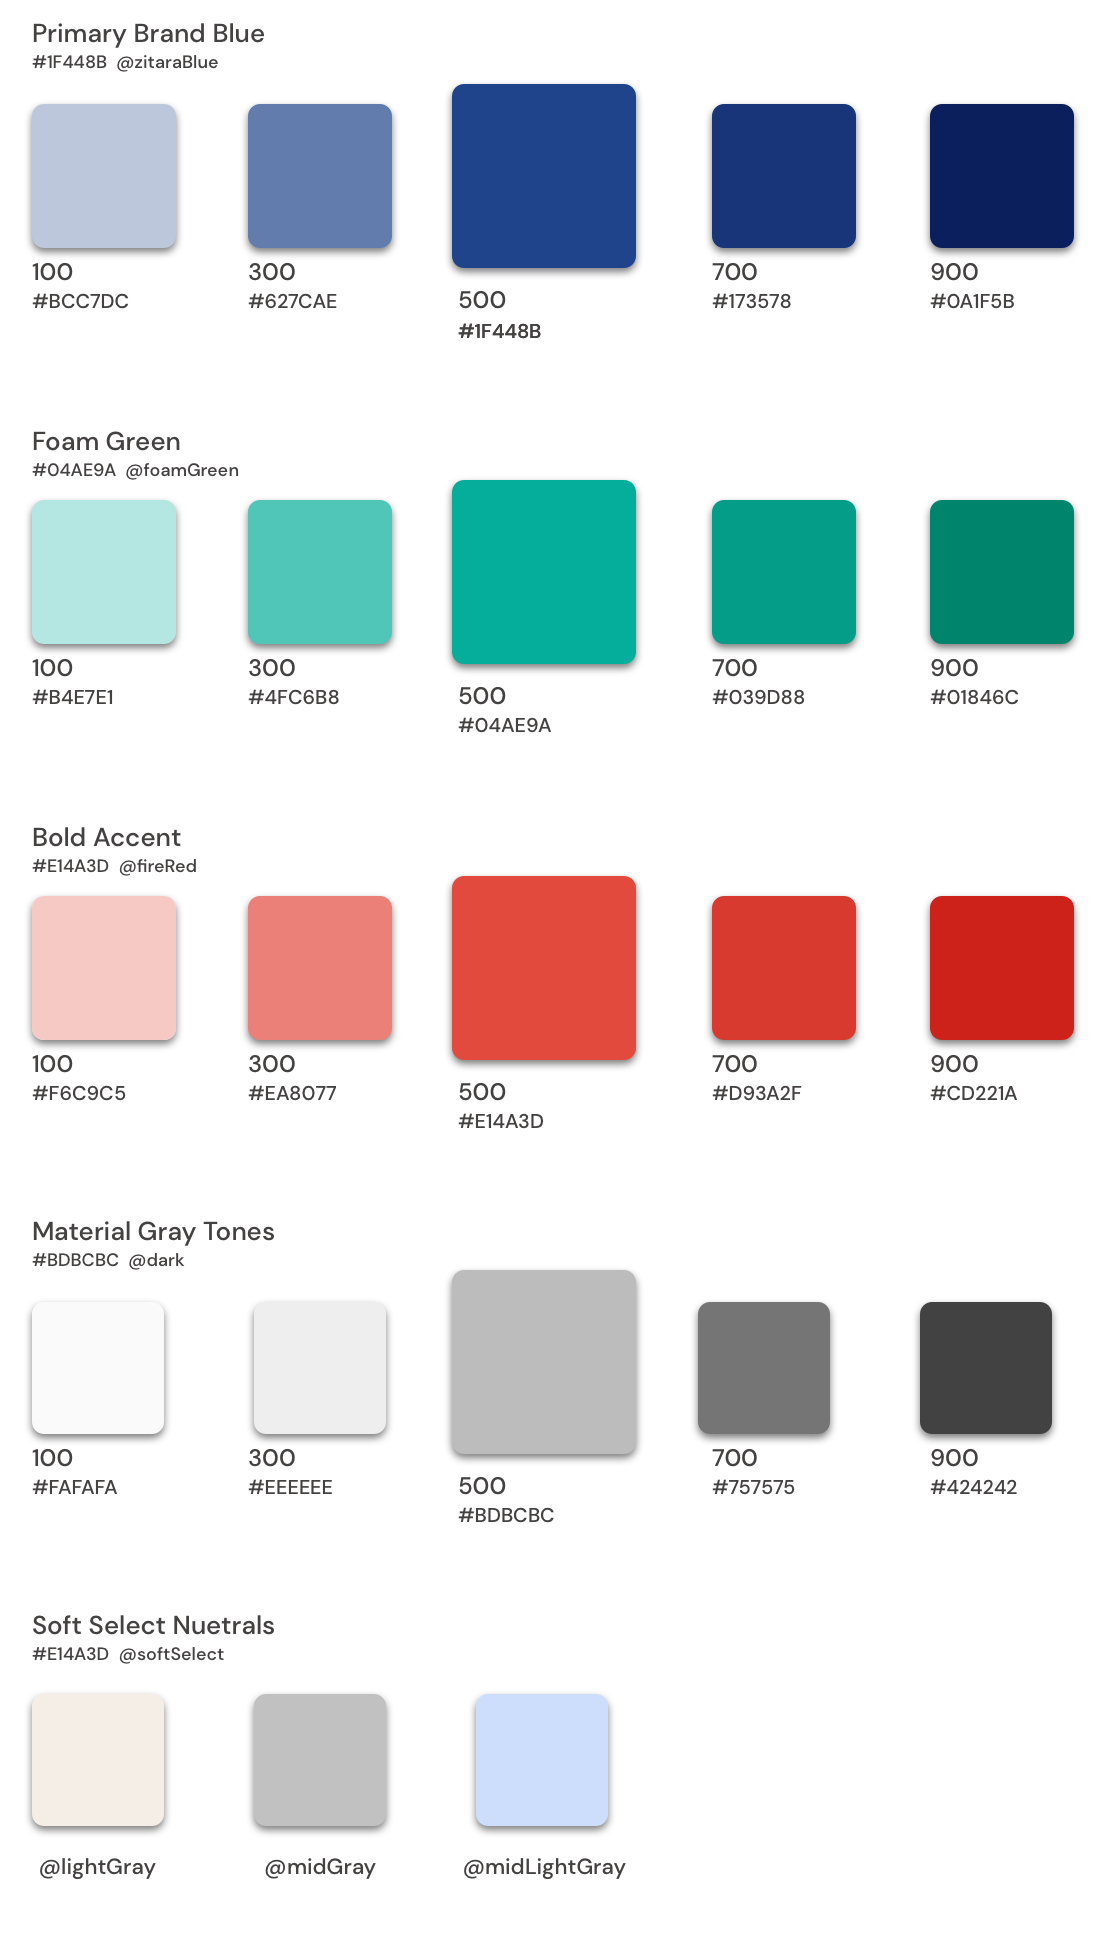
Color Selections
A color system developed by the Zitara team helps users to view actions, identify statuses, locate help, and figure out the next steps on a screen.
Adhering to a consistent color palette below to create a uniform and engaging user experience where all cognitive load is kept at its minimum.
Brand Colors
Brand colors depend on a product, service, or company. They can be used as interactive colors, especially when it is necessary to comply with accessibility regulations. All colors are also defined as design tokens — named elements or discrete entities that store specific variables (visual design attributes):
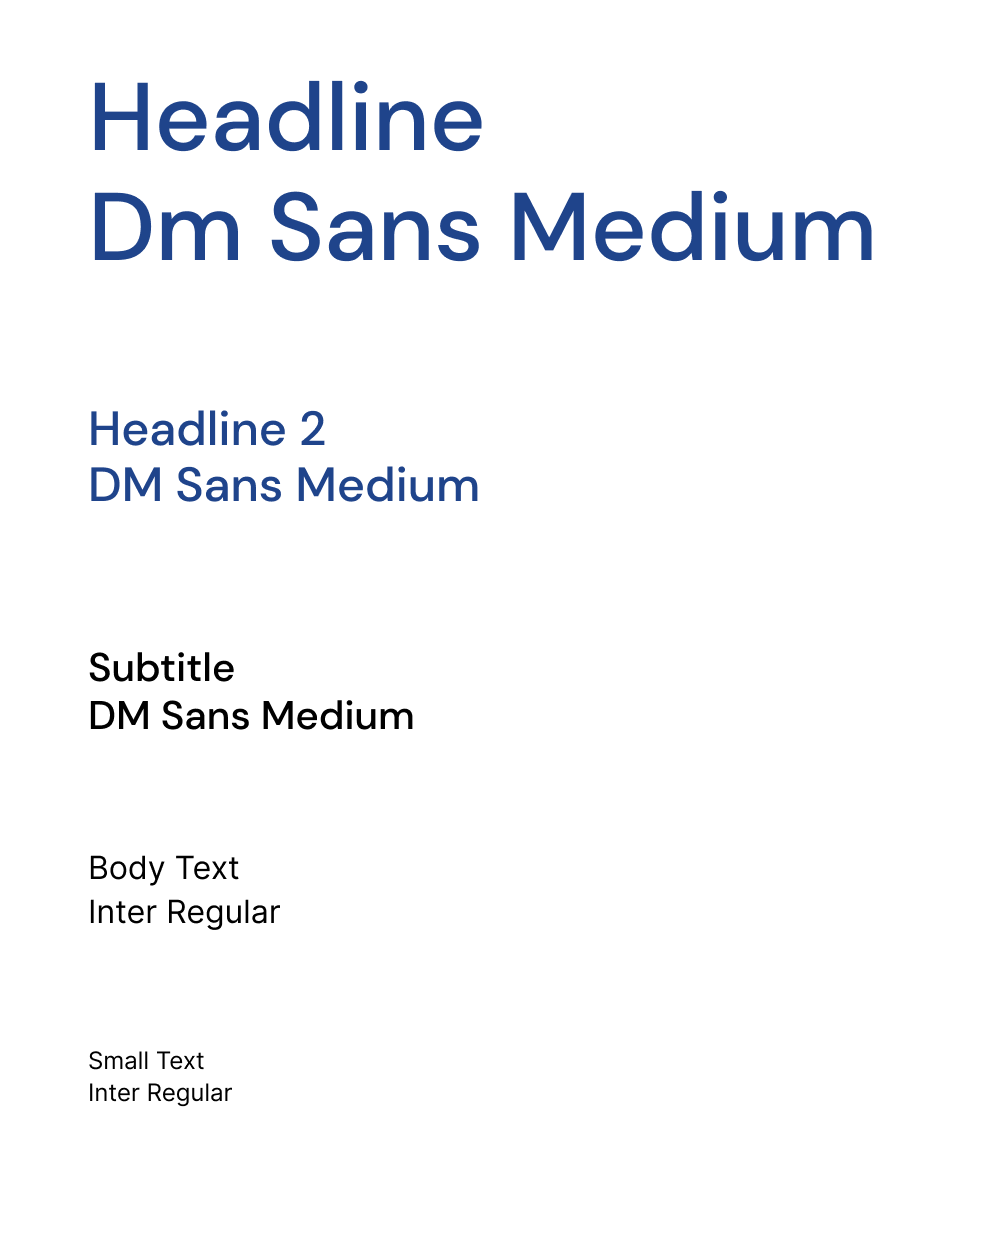
Brand Typography
The brand typography was chosen to be used with all brand assets. The font is DM Sans for headings and Inter for small copy.
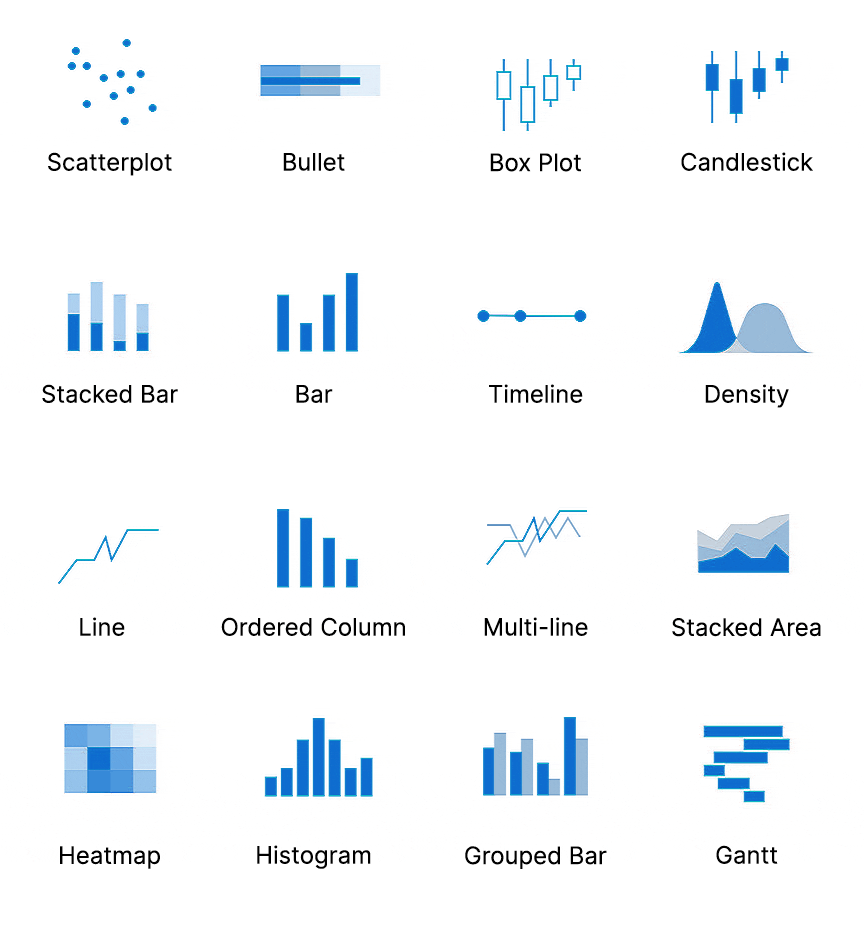
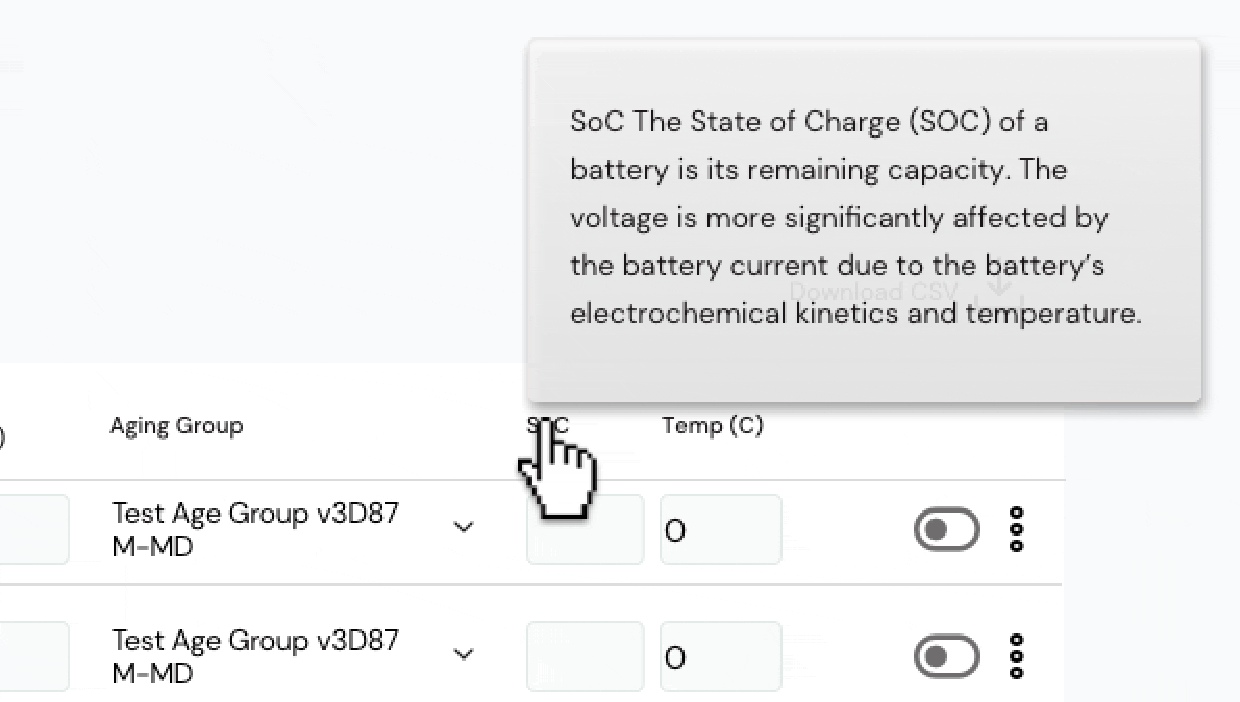
Data Visualisation Methods
Data visualization is the graphic representation of data provided. I have found that creating a product utilizing data visualizations with the goal of providing insight is fundamentally different from a typical user-centric web experience, although traditional UX process methods can help.
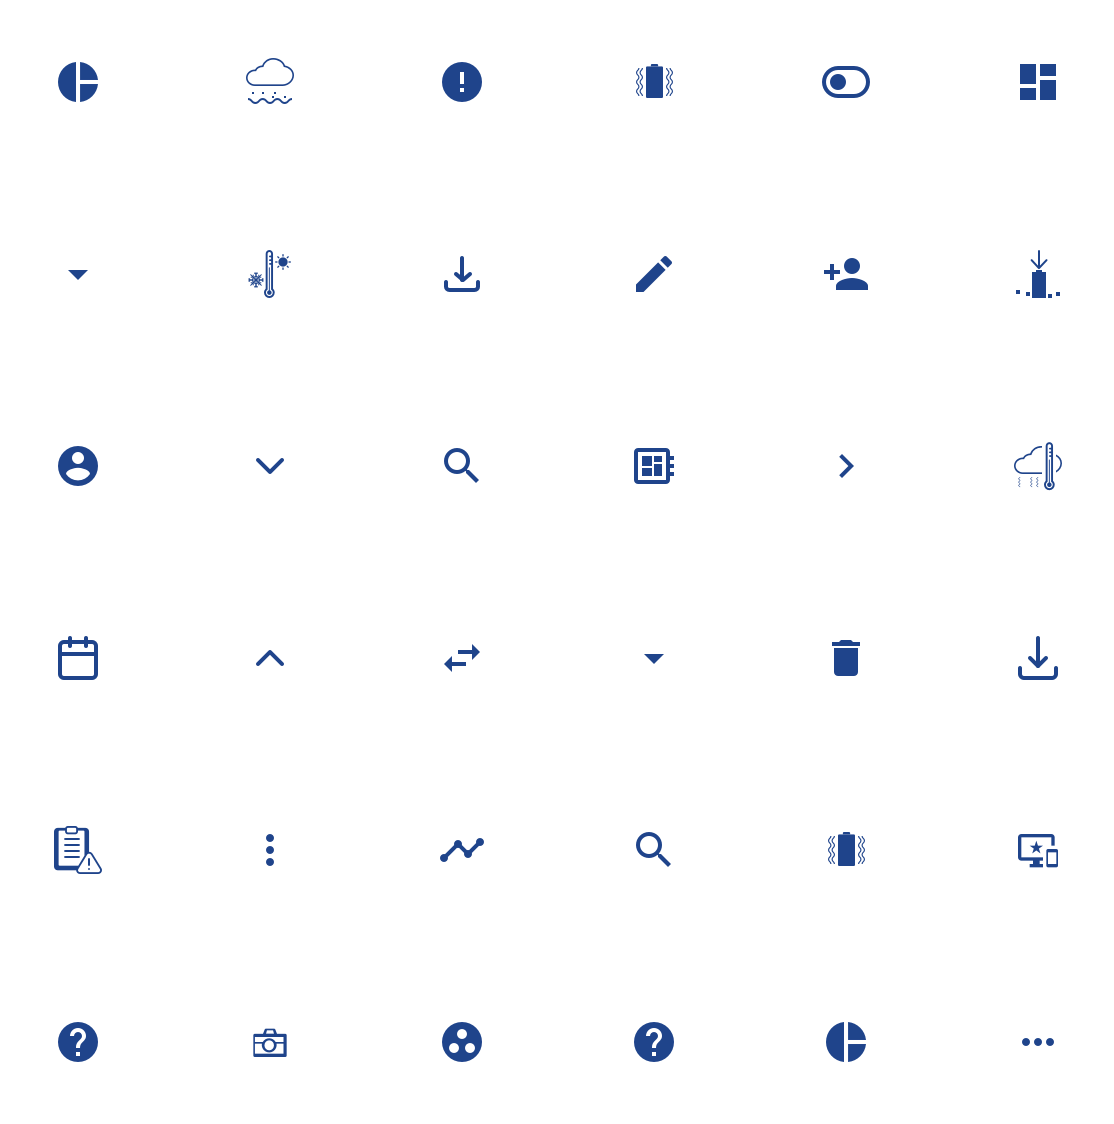
Iconography
The icons from the Material Design System were selected to symbolize common actions, files, devices, and directories. System icons are designed to be simple, modern, friendly, and sometimes quirky. Each icon is reduced to its minimal form, expressing essential characteristics.
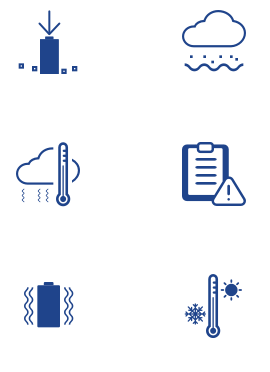
Special Icons
While Material Design includes some truly fantastic icons, they do not always meet our requirements or perform well with your project. Sufficiently effective, or nearly effective – does not fit with exceptional design.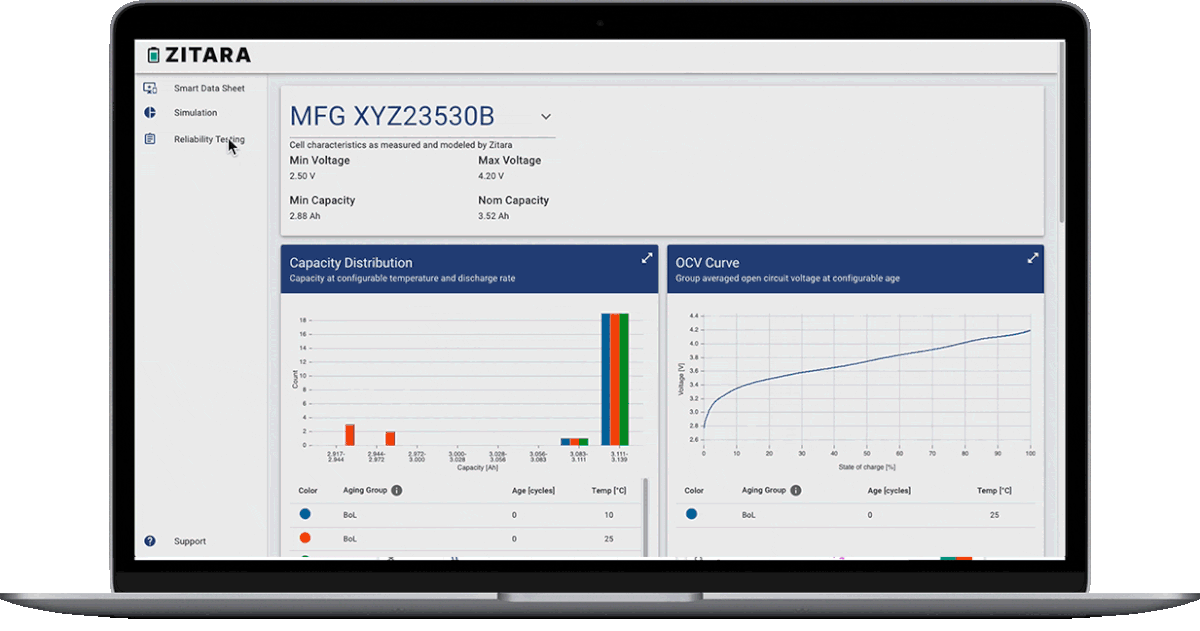
Gotta project?
Have questions?