Roles
UX/UI Design
User Research
Visual Design
Prototyping
User Testing
Overview
Designing a mobile application for a mid-sized midwestern metropolitan area. The goal was to reduce the stress and anxiety that passengers can feel when they are unsure of when and if a bus will arrive at a stop or station.
The Problem
Passengers were struggling with knowing exactly when each bus would arrive at the various stops and stations across the city. They required a way to share the real-time location information of the busses with the riders to reduce the complaints, anxieties, and stress that the passengers were having using the city's bus system.
So many options!
A few statistics found in the Chicago Transit Authority (CTA) facts page can help visualize the of the scope of the issue.
Buses: 1,864
Routes: 129
Stops: 10,768
The Solution
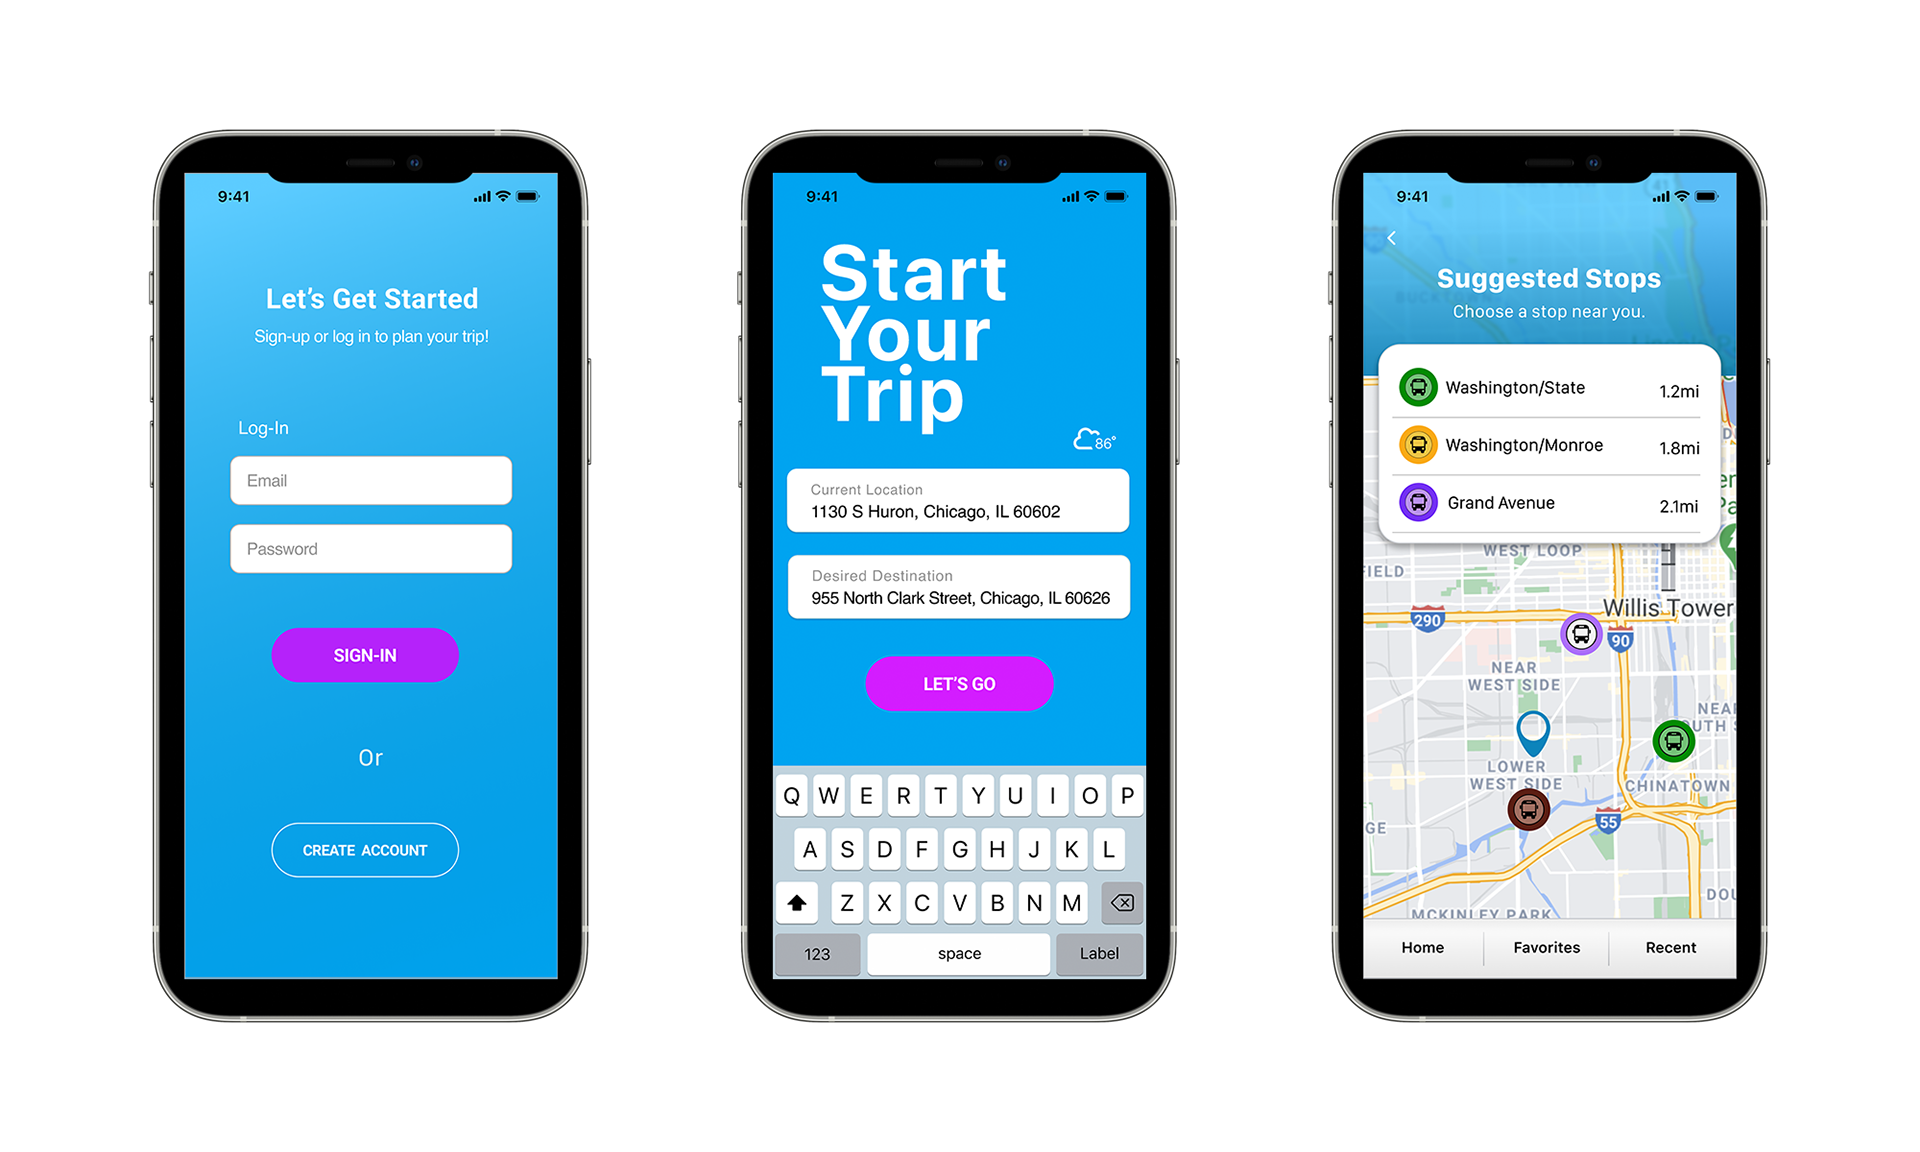
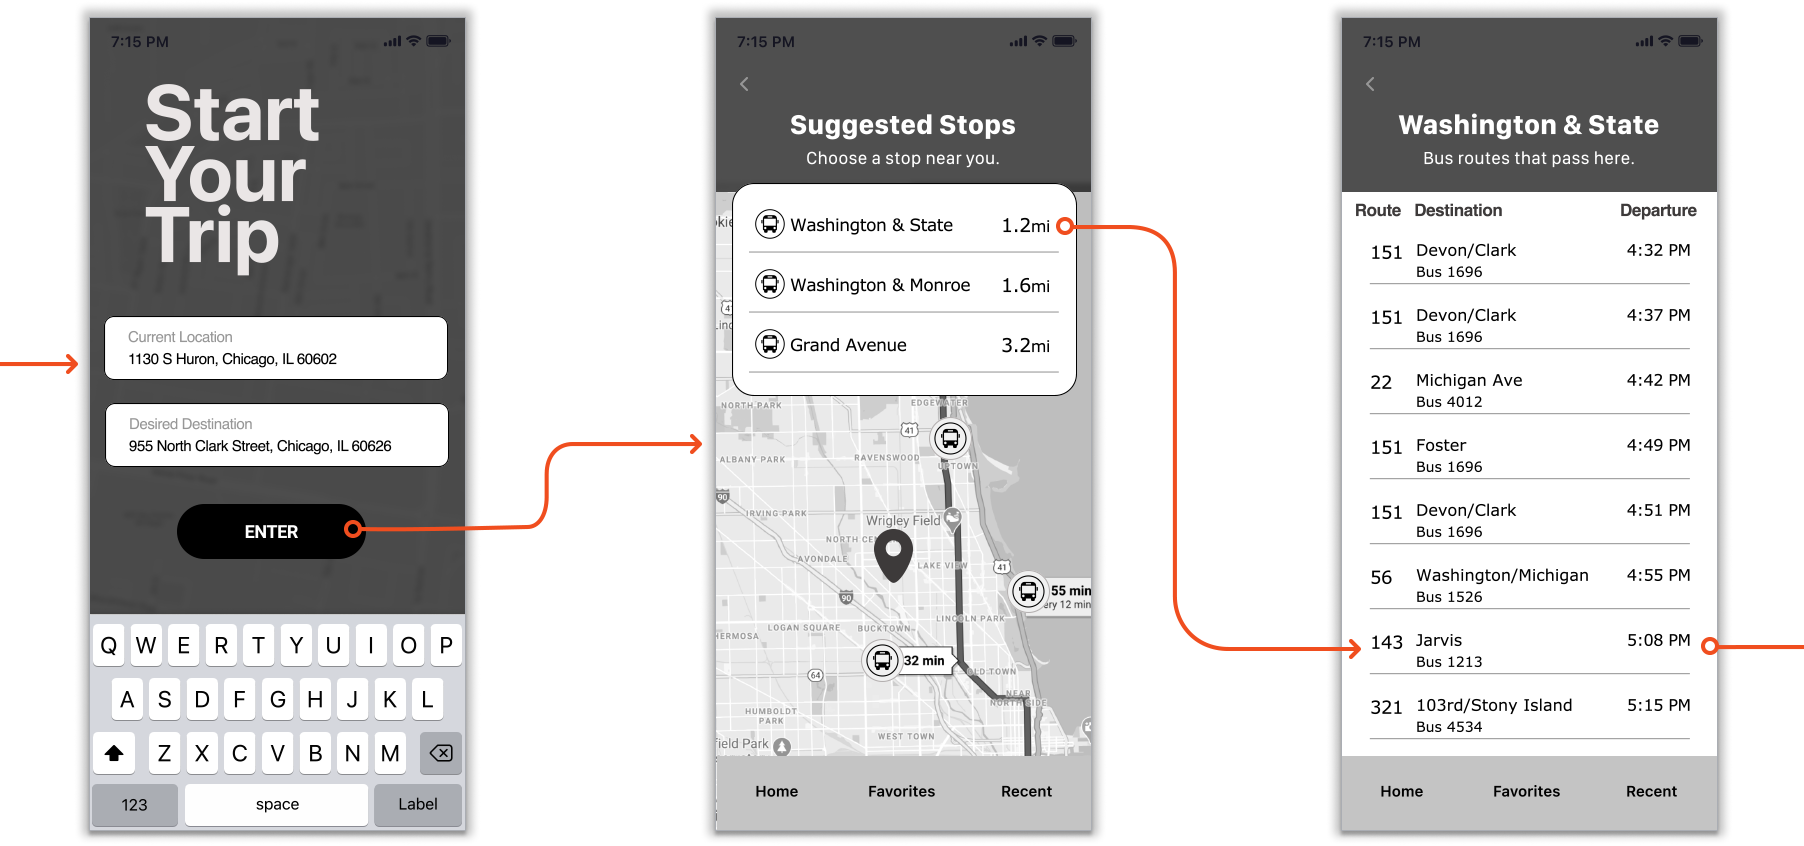
Bus Happy is a simple bus application that gets riders where they need to be in an easy and accurate way. The goal was to try and reduce the burden and the stress of the unknowns while riding the bus. This application was design in a way to get you in the app and planning your travel without the burden of having to navigate through ancillary screens before you can start your journey.
Process
This project was developed under the most rigorous user centric microscope. To help systematically extract, learn and apply these human-centered techniques to solve the problem in a creative and innovative way.
Using the Design Thinking Process
Design Thinking
Definition: The design thinking ideology asserts that a hands-on, user-centric approach to problem solving can lead to innovation, and innovation can lead to differentiation and a competitive advantage. This hands-on, user-centric approach is defined by the design thinking process and comprises 6 distinct phases, as defined and illustrated below.
Definition: The design thinking ideology asserts that a hands-on, user-centric approach to problem solving can lead to innovation, and innovation can lead to differentiation and a competitive advantage. This hands-on, user-centric approach is defined by the design thinking process and comprises 6 distinct phases, as defined and illustrated below.
www.nngroup.com
Discover
During the discovery phase a competitive analysis, user survey, interviews and analysis were done in order to create the most user-centric experience possible by getting well balanced data.
Competitive Analysis
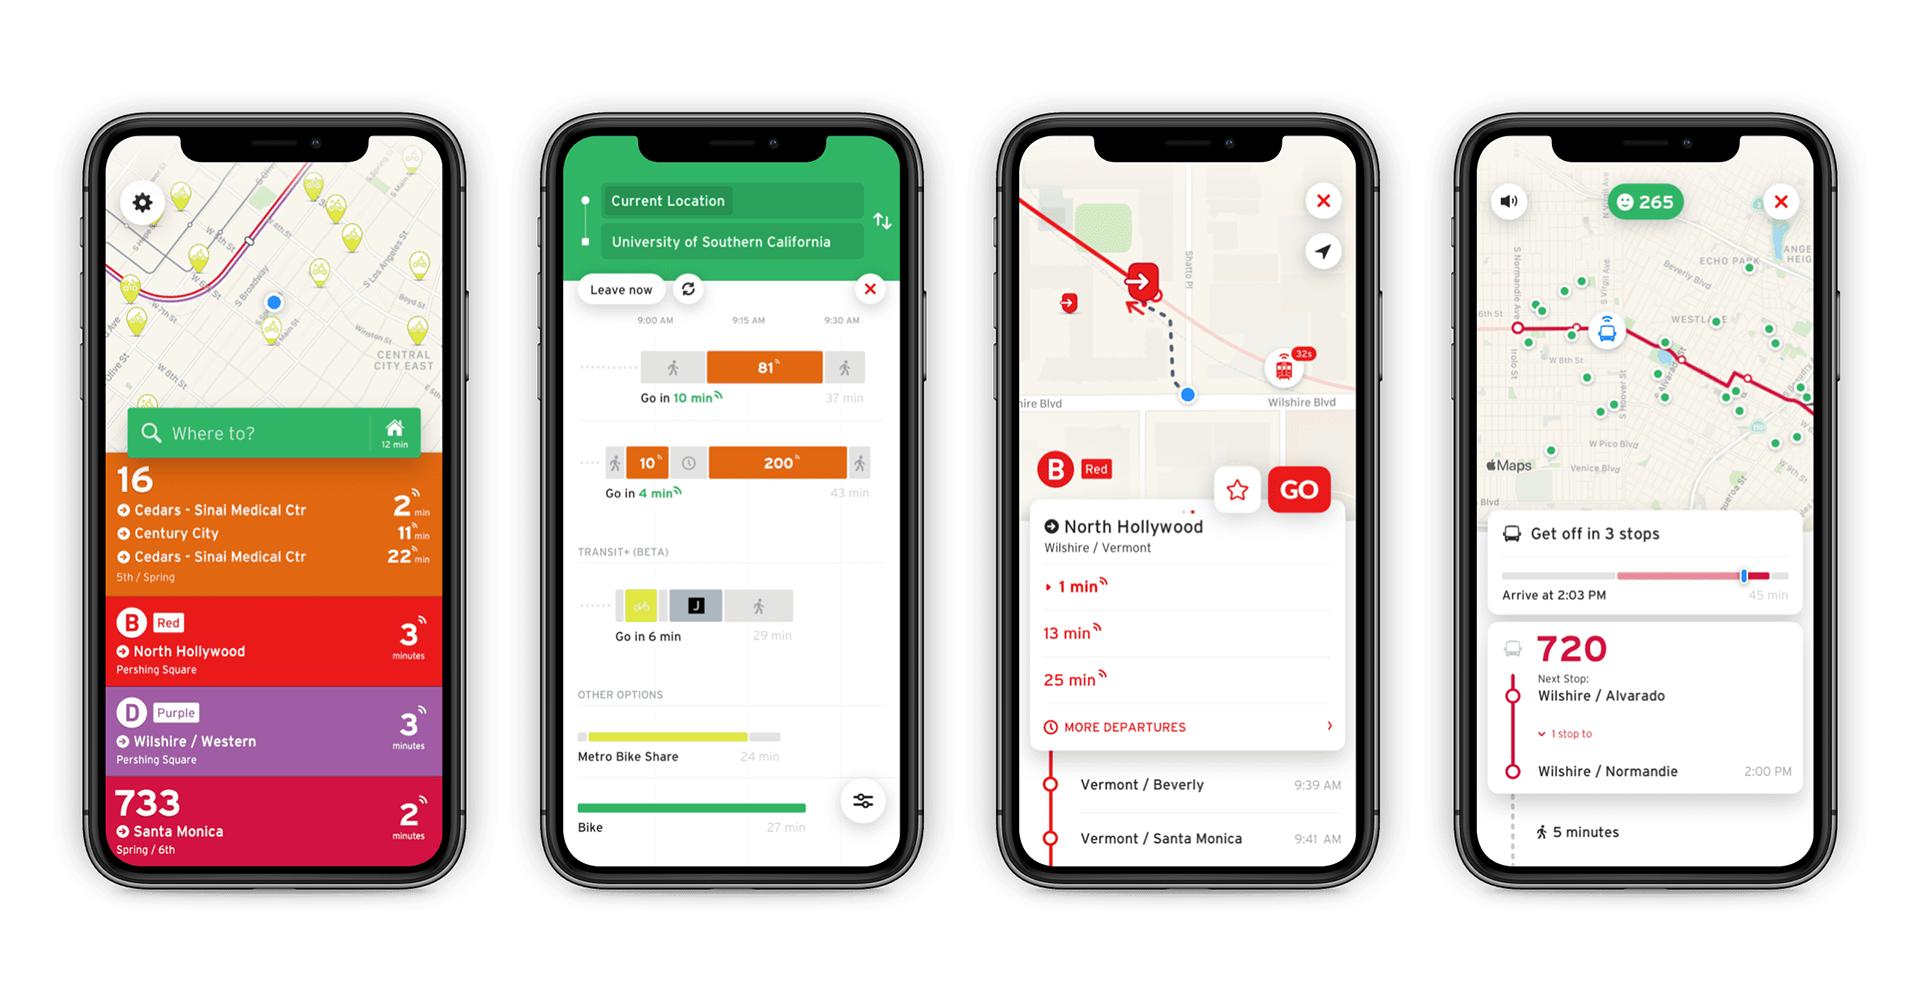
I wanted to start the discovery by getting a feel for what kind of options are available out there for this type of app. What do these different applications do well, what don’t they do well, and areas of opportunity that could be done or used to make this new application stand out. Two that I focused specifically on were Transit and Moovit.
First, Transit is a mobile app providing real-time public transit data. The app functions in over 175 metropolitan areas around the world. Transit was designed for aggregating and mapping real-time public transit data, crowdsourcing user data to determine the true location of buses and trains. Transit was first released in 2012 for iPhone and soon after launched the Android-compatible version. It offers users schedules and alerts for multiple modes of transportation where available, including bus and rail.
Strengths
• Good UI elements and Iconography
• Ability to “Favorite” bus lines
• Calendar Sync for navigation to events
• Ability to see all bus lines
Weaknesses
• Challenging to navigate application
• Too much information for some
• Confusing navigation features
Moovit is a public transportation and journey planner app. The company uses both crowdsourced and official public transit data to provide route planning to users as well as transit data APIs to transit companies, cities, and transit agencies. Because Moovit integrates crowdsourced data, it is able to provide transit information for areas where no data is officially available.
Strengths
• Familiar Interface and Icons
• See different modes of getting there
• Calendar Sync for navigation to events
• Navigation was easy and intuitive
Weaknesses
• Challenging to navigate application
• Could not select favorites
• No ability to save notifications
Users & Audience
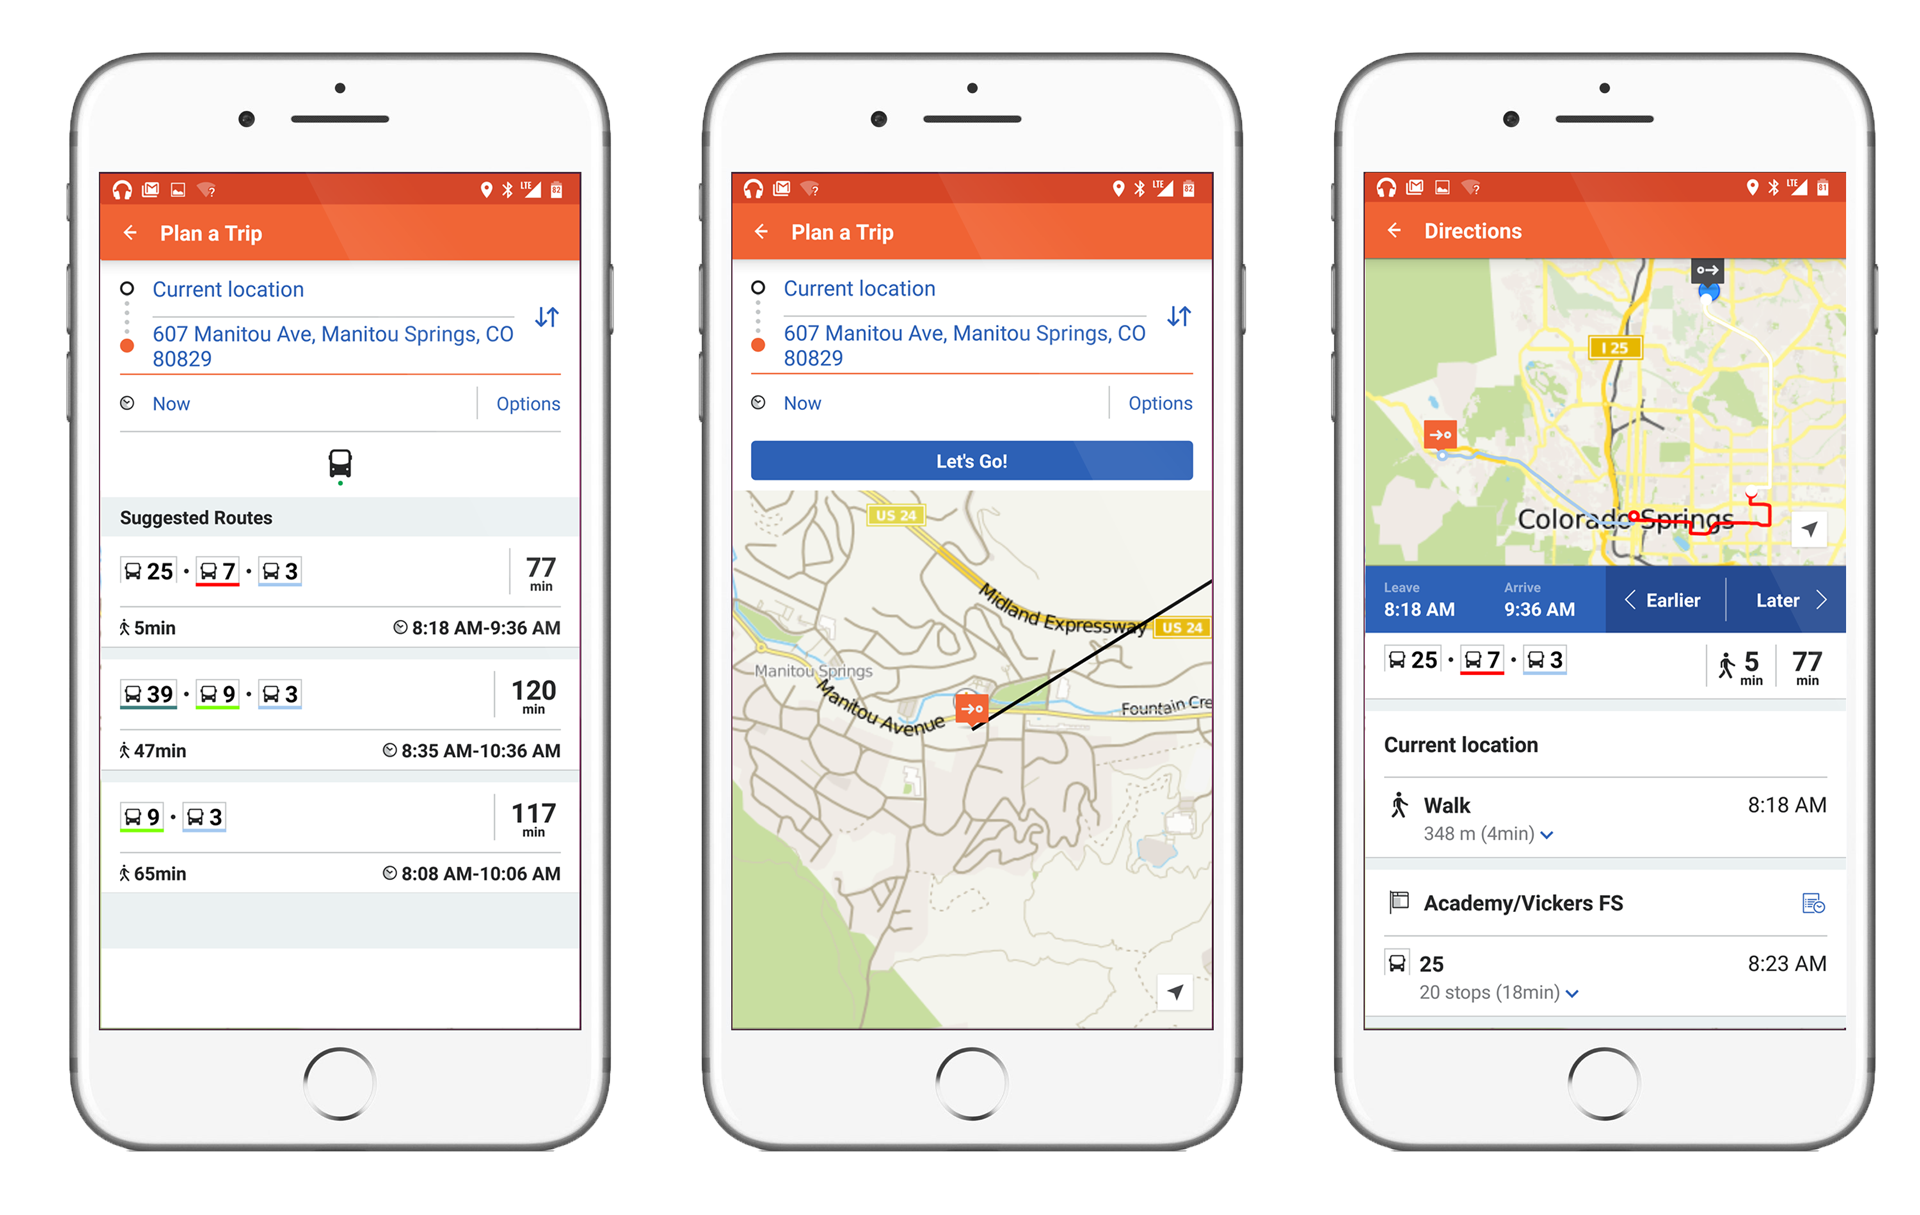
To learn more about our audience, a survey was conducted via Google Forms. This included bus usage, transit app and demographics questions. The surveys were followed up by a user interviews, conducted over the phone, in which there were five participants.
User Surveys
A survey was created and presented to individuals who ride the bus and gather some quantitative data from a sample of potential users. I wanted people who would find this application useful and have it provide a positive impact on their transportation world.
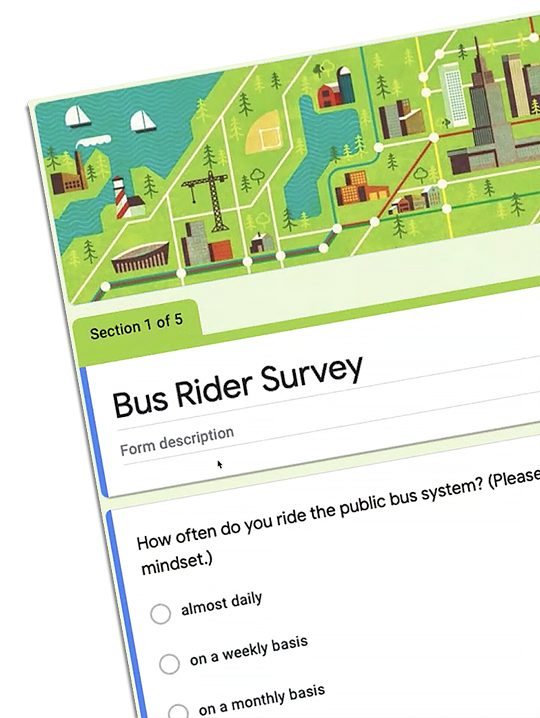
Most of the people surveyed (55%) reported to use a mobile app to find the bus they need.
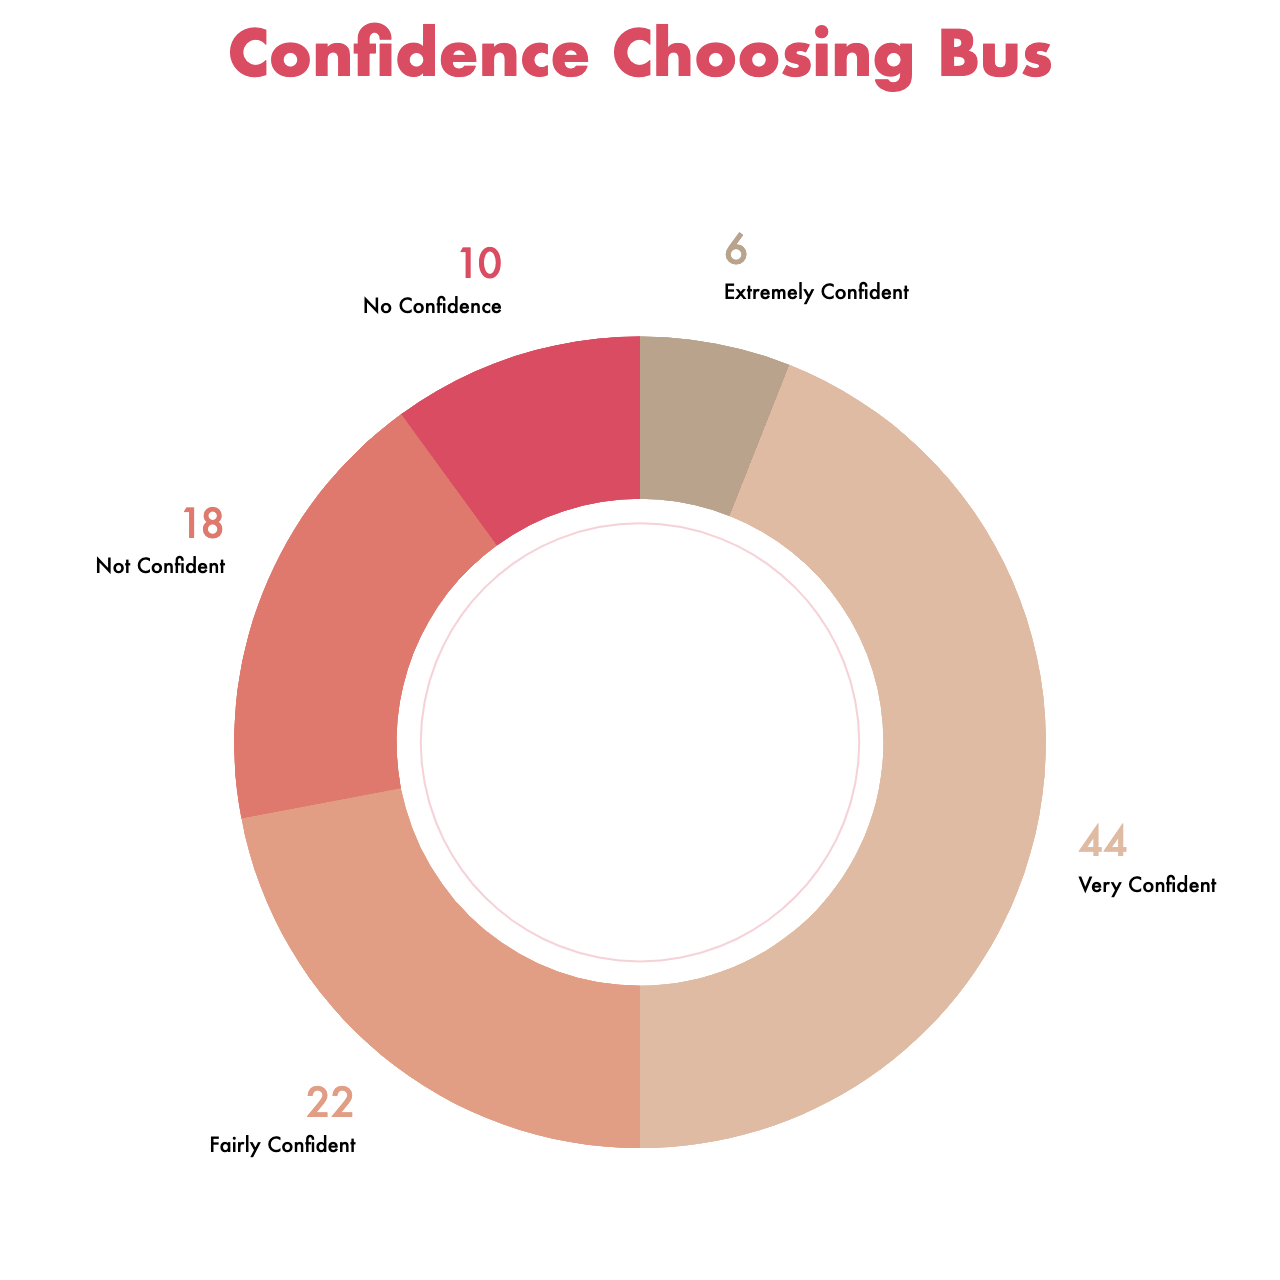
44% of participants said they were very confident in their method of choosing the bus to ride. Yet, 18% were not confident.
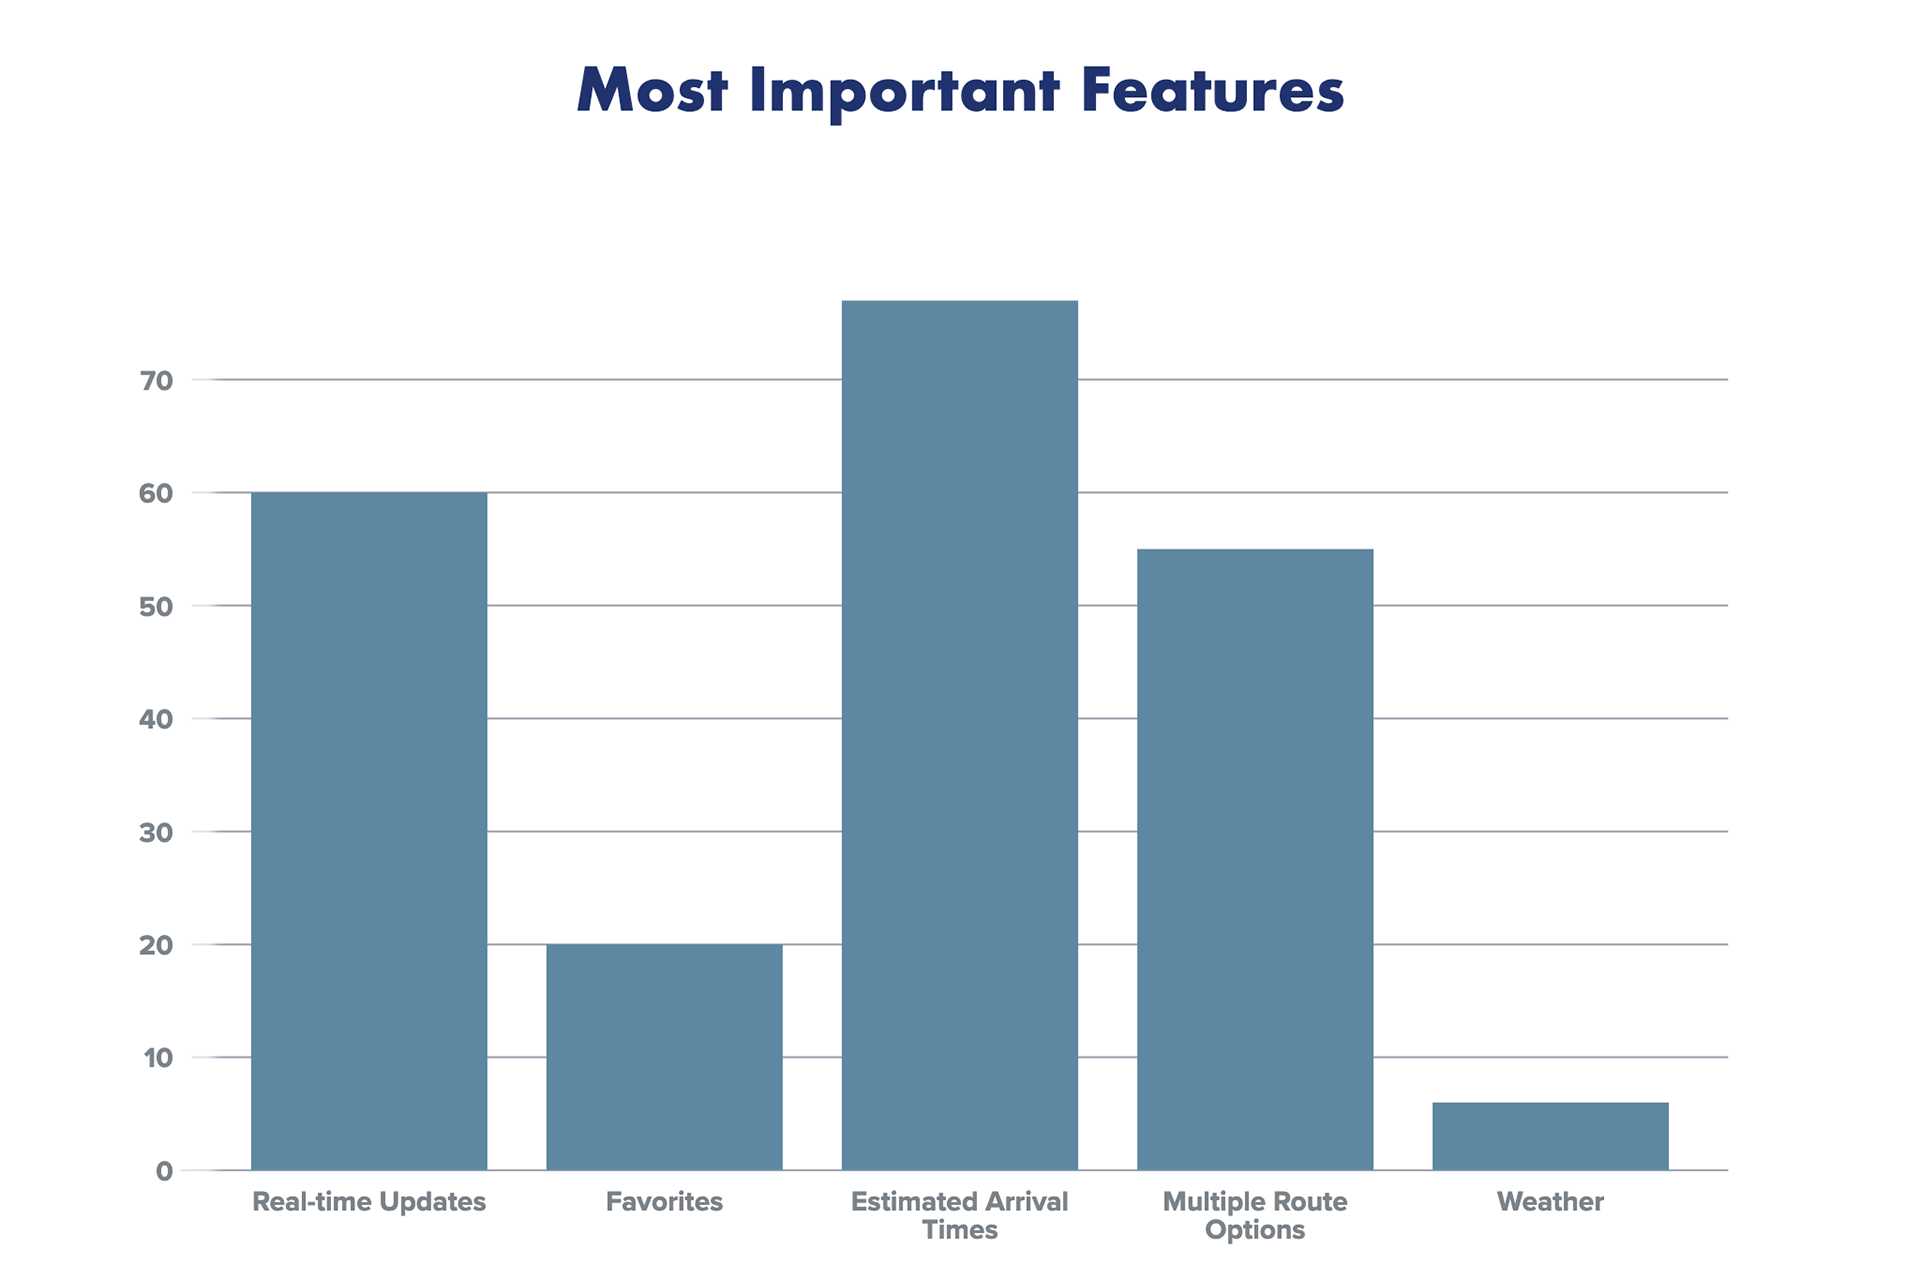
Estimated arrival times, multiple route options and real-time updates are the most important features according to the people who were surveyed.
User Interviews
A round of user interviews were performed by a variety of users in order to further gain some qualitative insights direct and in their own words. Below are some of the more prominent finding that were shared during the interviews.
The findings
• Unexpected delays and route changes is the largest concern
• Some individuals prefer Google Maps for bus timing
• A pain point for this is that they found the layout confusing
• Prefer a simple map asking them “where would they like to go?”
• Unsure if they’re taking the right busses or stops
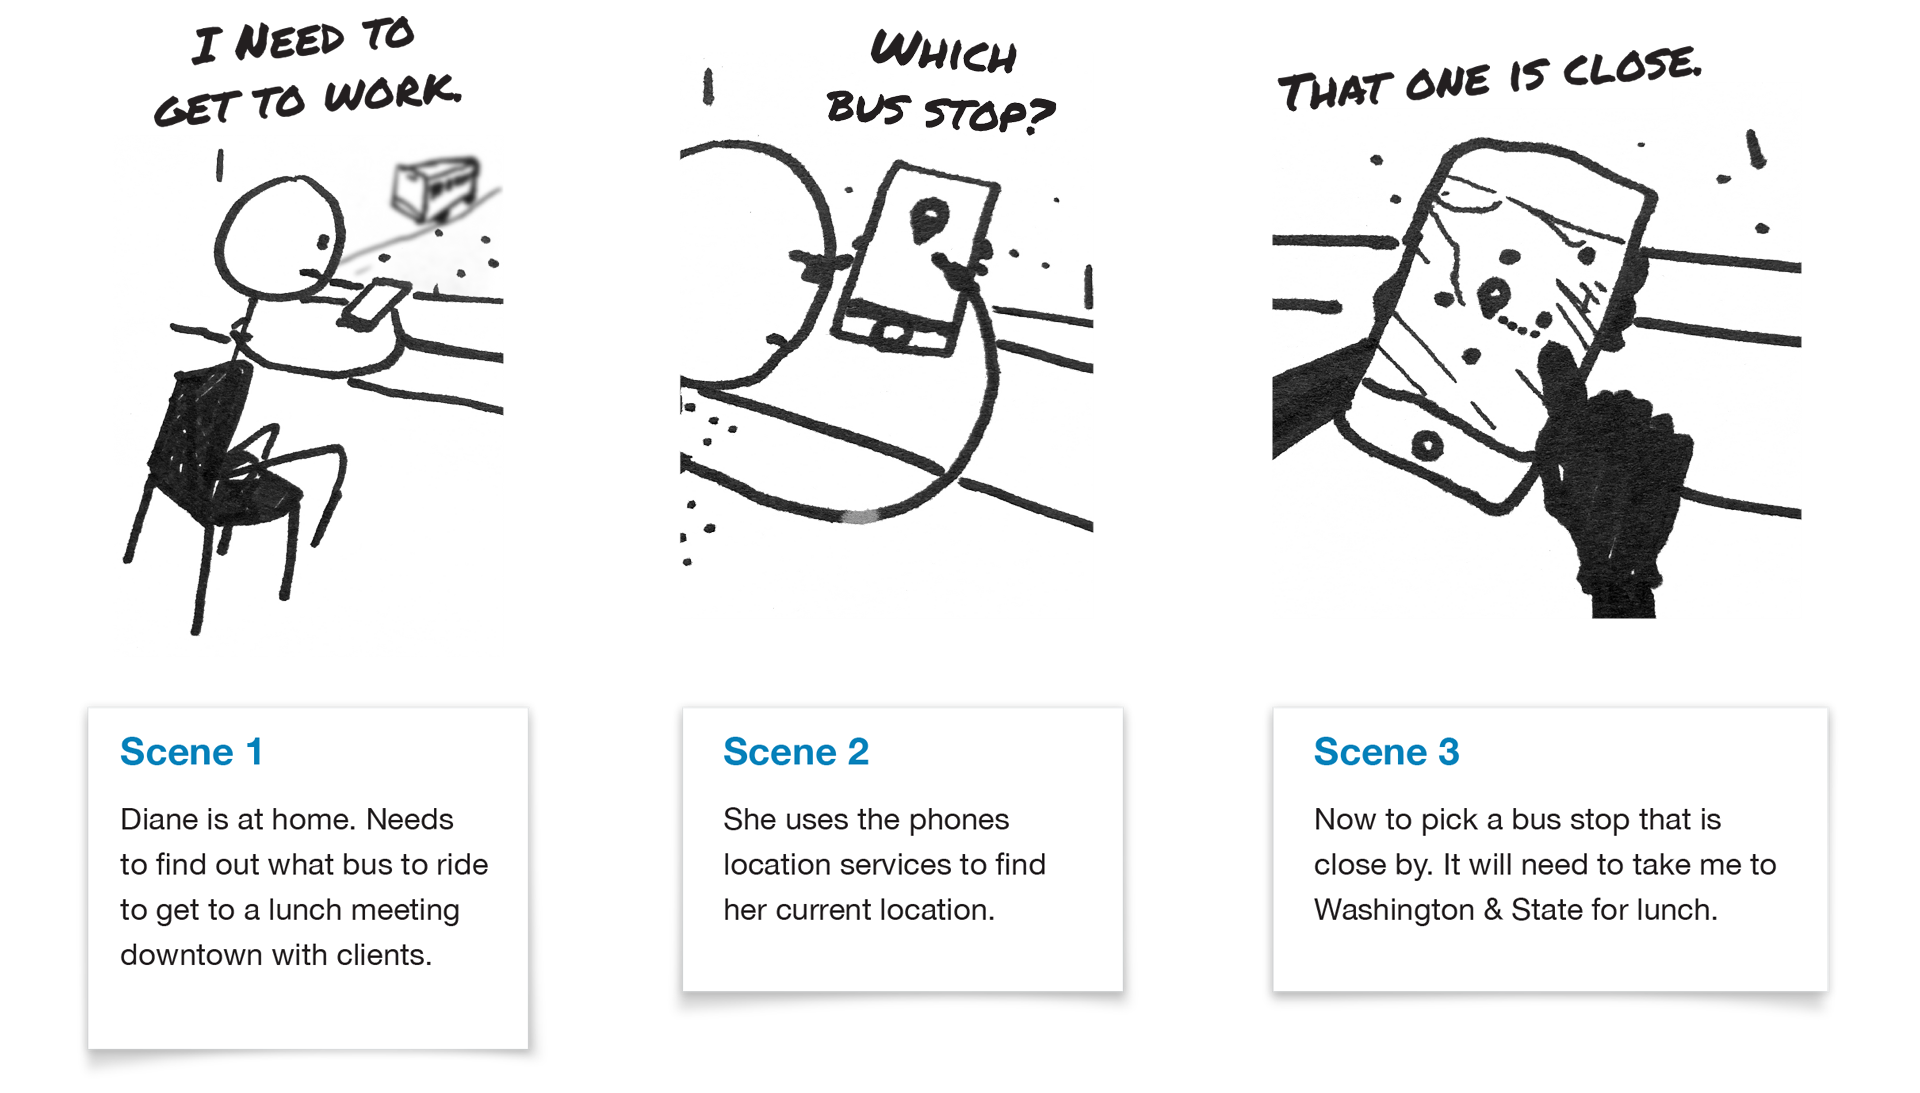
.Creating Storyboards
Creating a few storyboards helped to identify a few points of interest during the scenario of riding the bus across town. The following is on such example.
Journey Mapping
A bus rider journey map was developed as a visual representation of the rider journey. Helping to gain a deeper understanding of the experience across all phases of the journey.
Define
This stage is in order to gather and document ideas to establish features, functions, and any other elements that will allow riders to solve the problems with the minimum of difficulty.
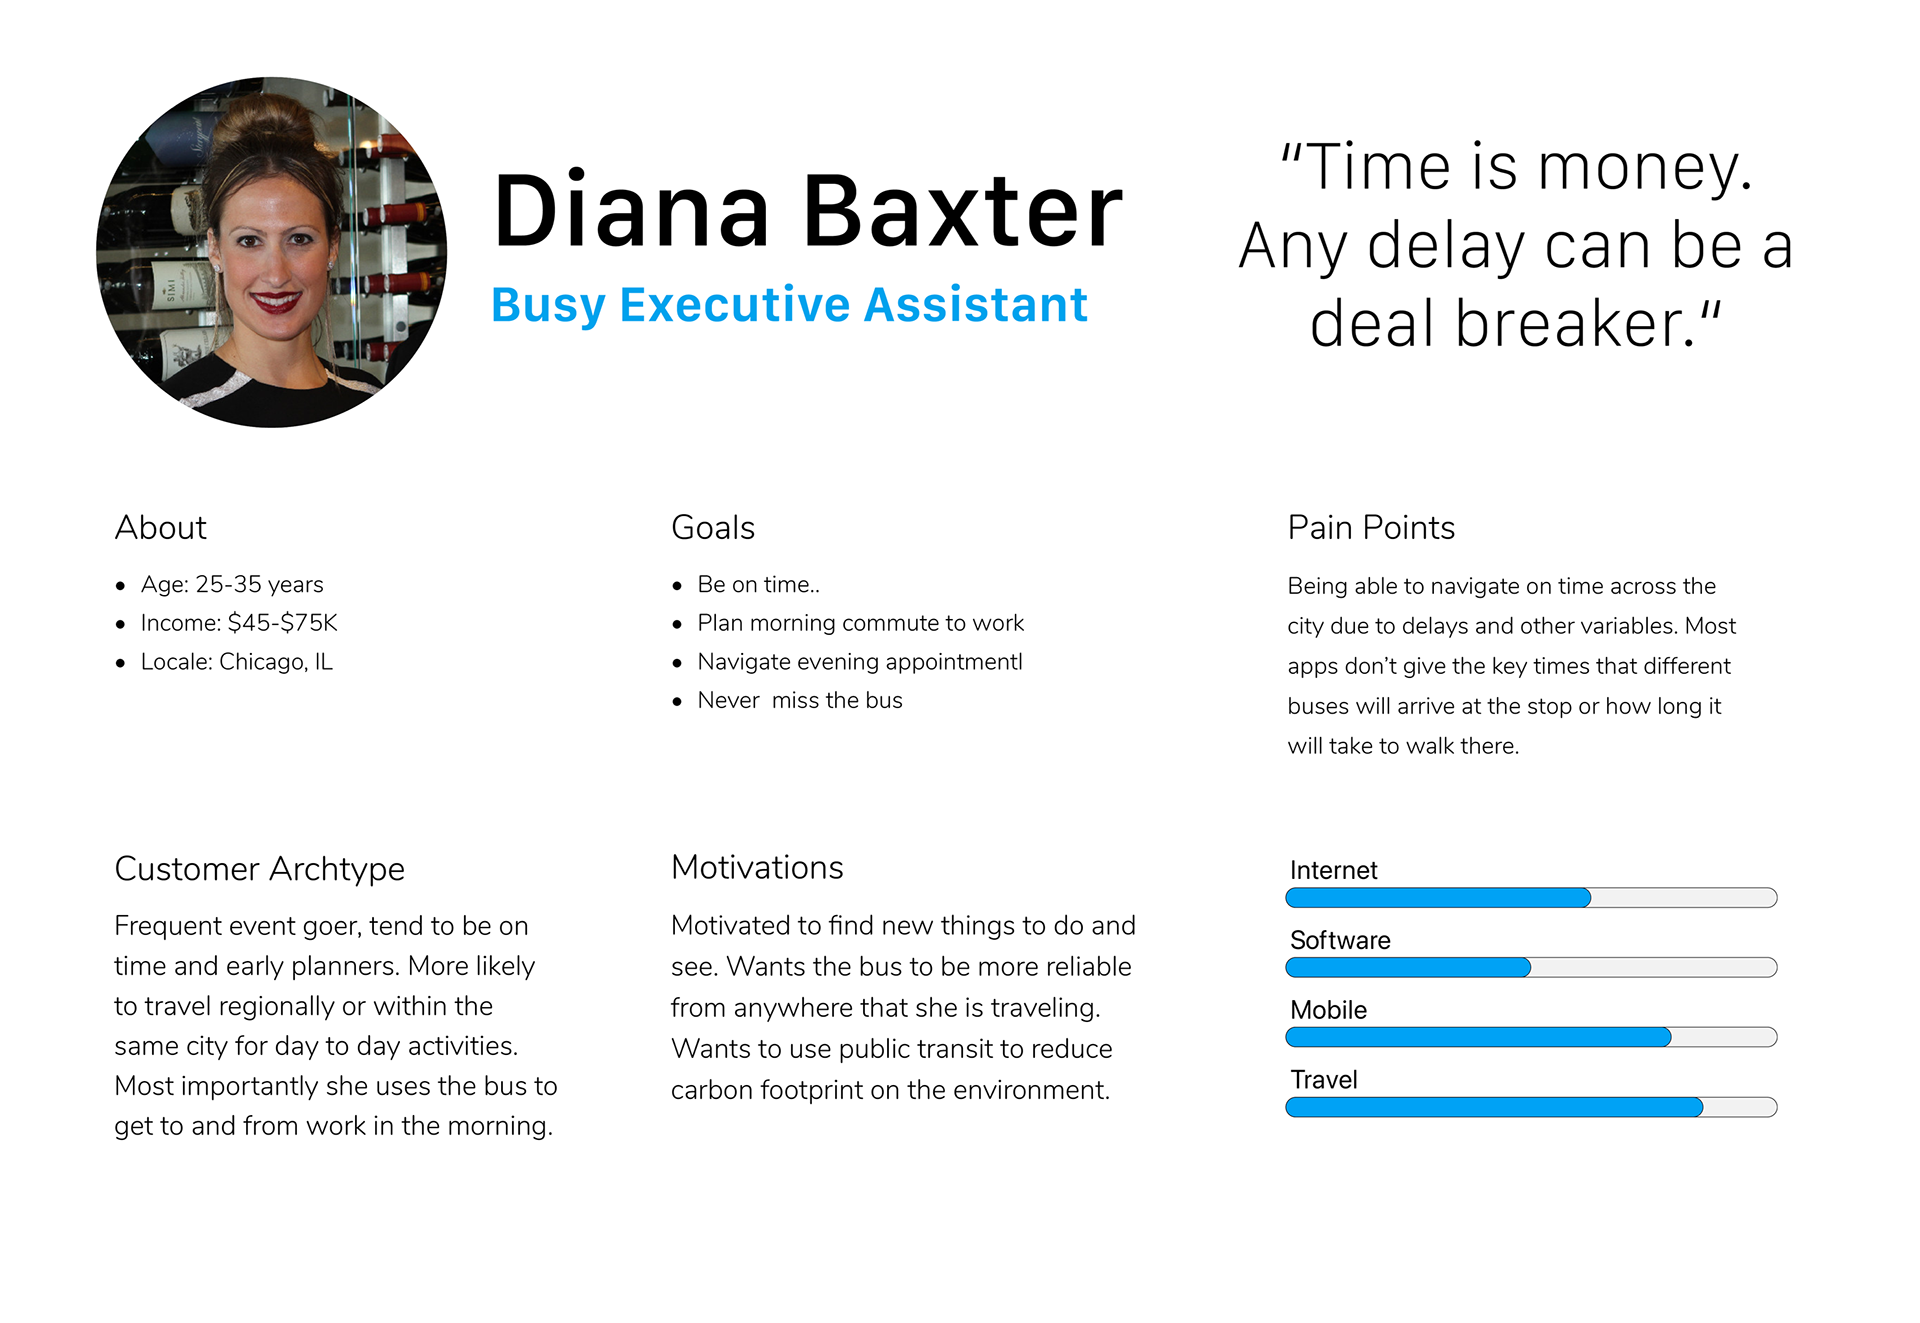
Personas
A few personas were created around target consumers to model our user stories after into any challenges that go along with riding the bus.
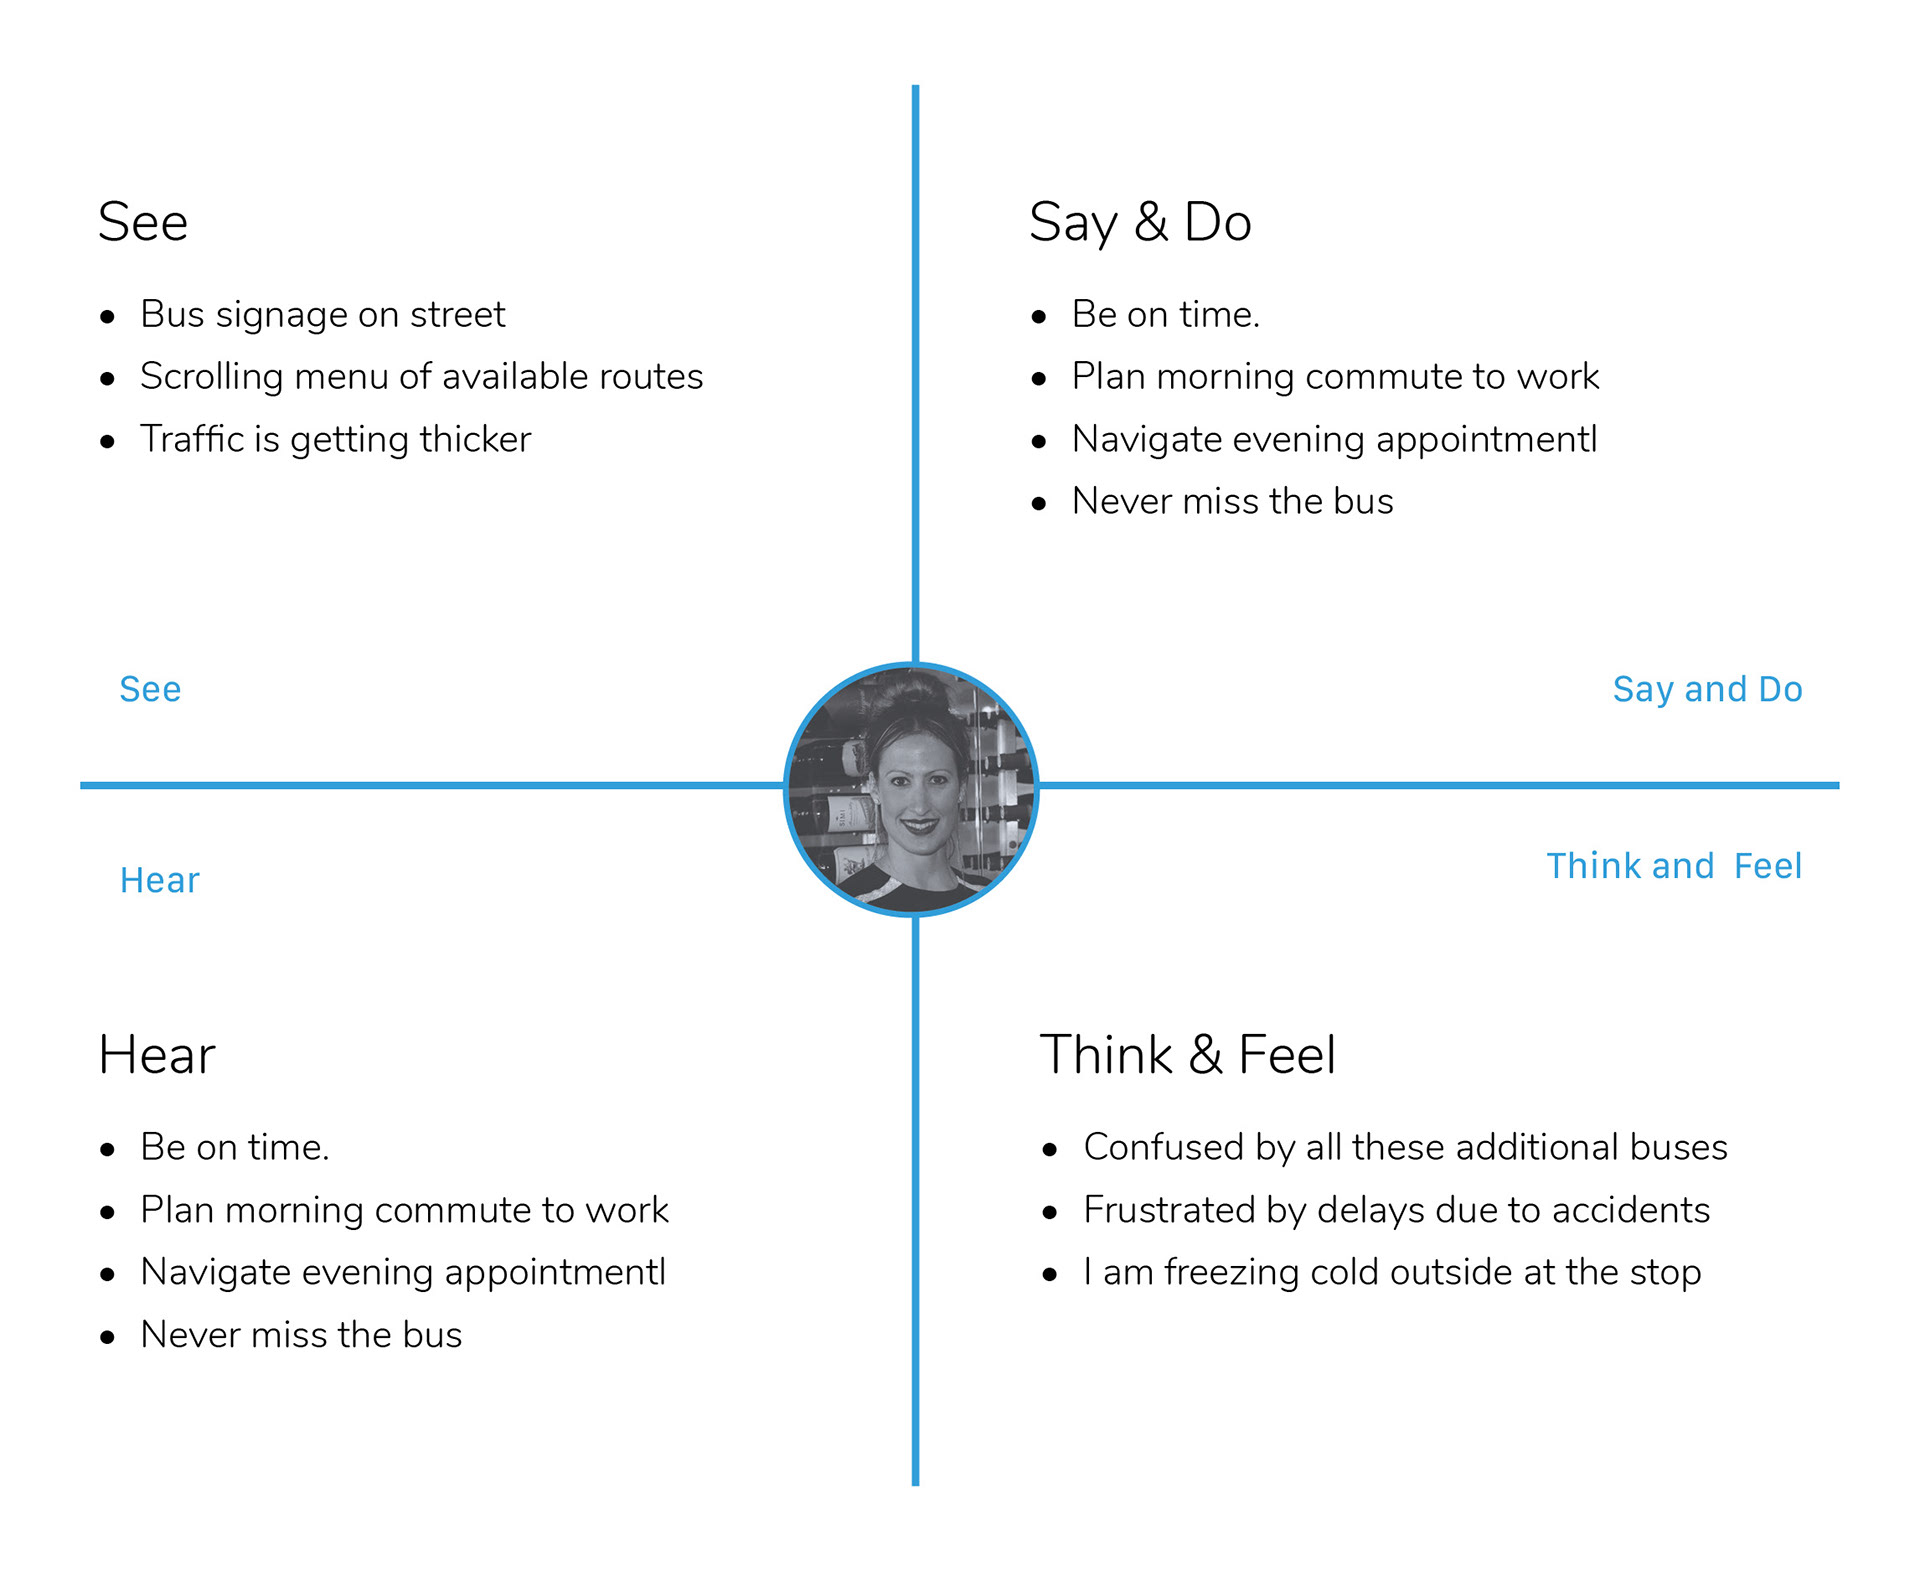
Empathy Map
An empathy map is a simple, easy-to-digest visual that is a useful tool to help "get inside the mind" of the user. The rider experiences a wide variety of things during the process of travel.
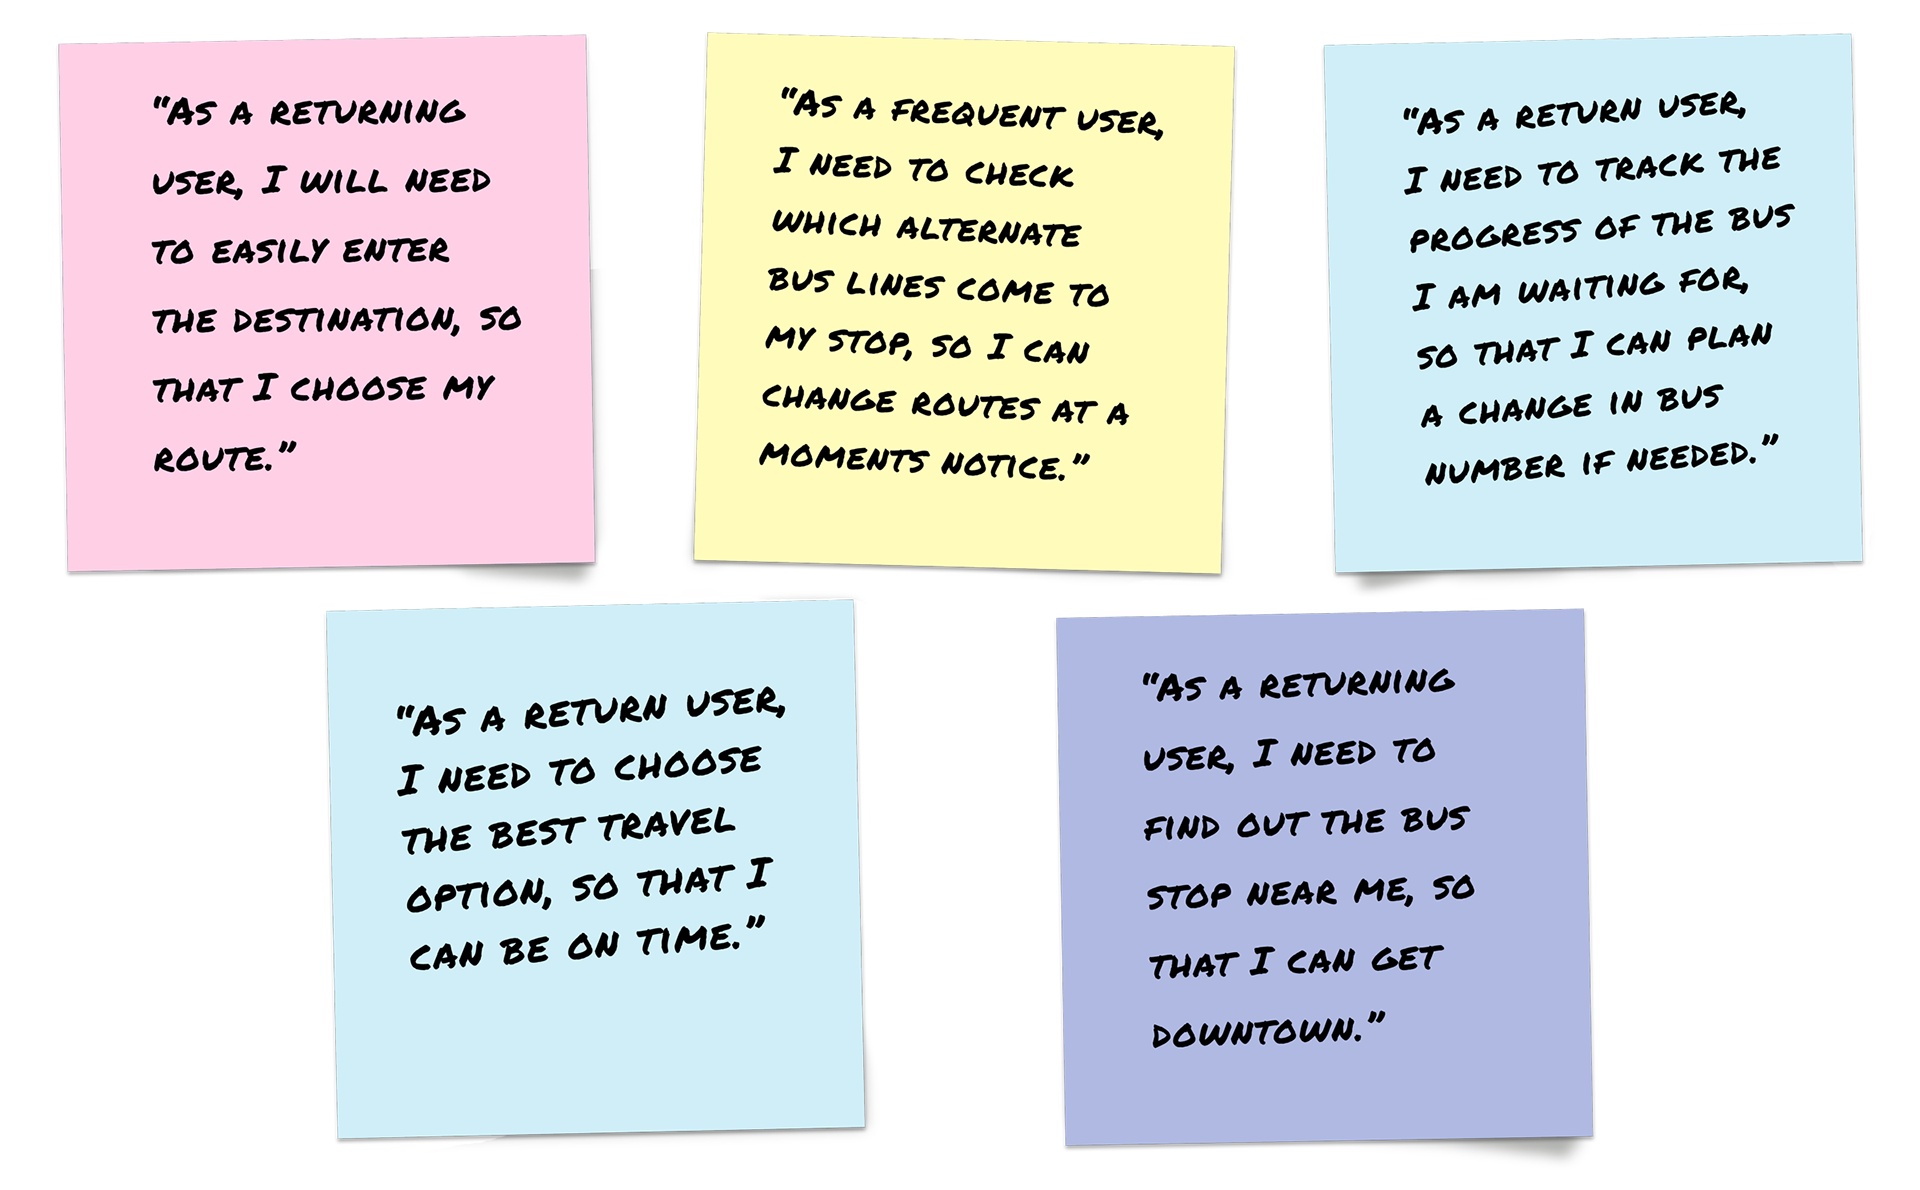
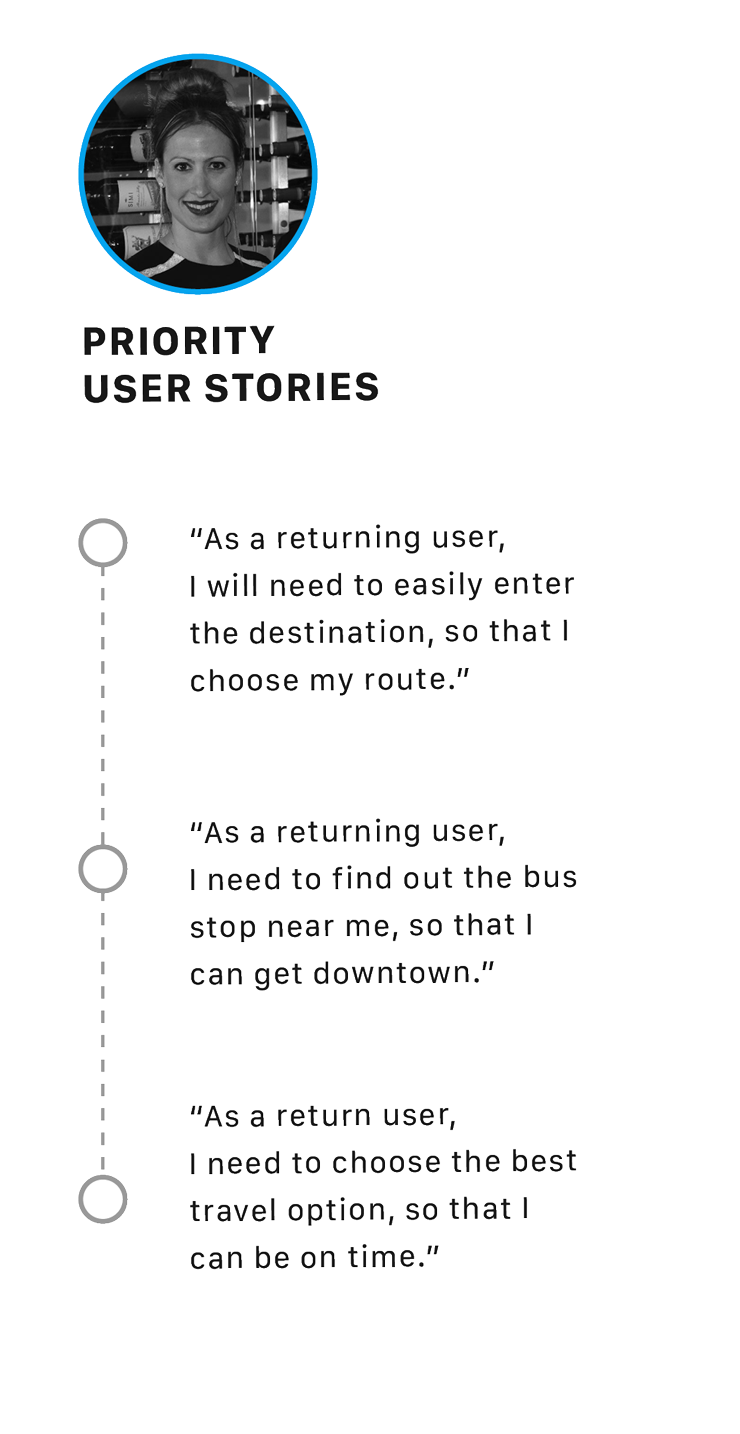
User Story
The user story allows us the ability to narrow our scope towards our most important wants and needs of the user. Only capturing the essential elements of the specific requirements.
“As a [persona], I want to [do something]
so that I can [realize a goal]”
so that I can [realize a goal]”
This format is designed to help be descriptive and to drive better discussions about implementation. Below are the the user stories that were created.
Ideate
The goal of this design phase is to generate a large number of ideas — ideas that potentially inspire newer, better ideas — then refining them into the best, most practical and innovative ones.
User Flow
After creating a persona and the priorities for the user into a user story. It was time to begin ideating to towards the ideal path or a set of steps towards a successful outcome and final action.
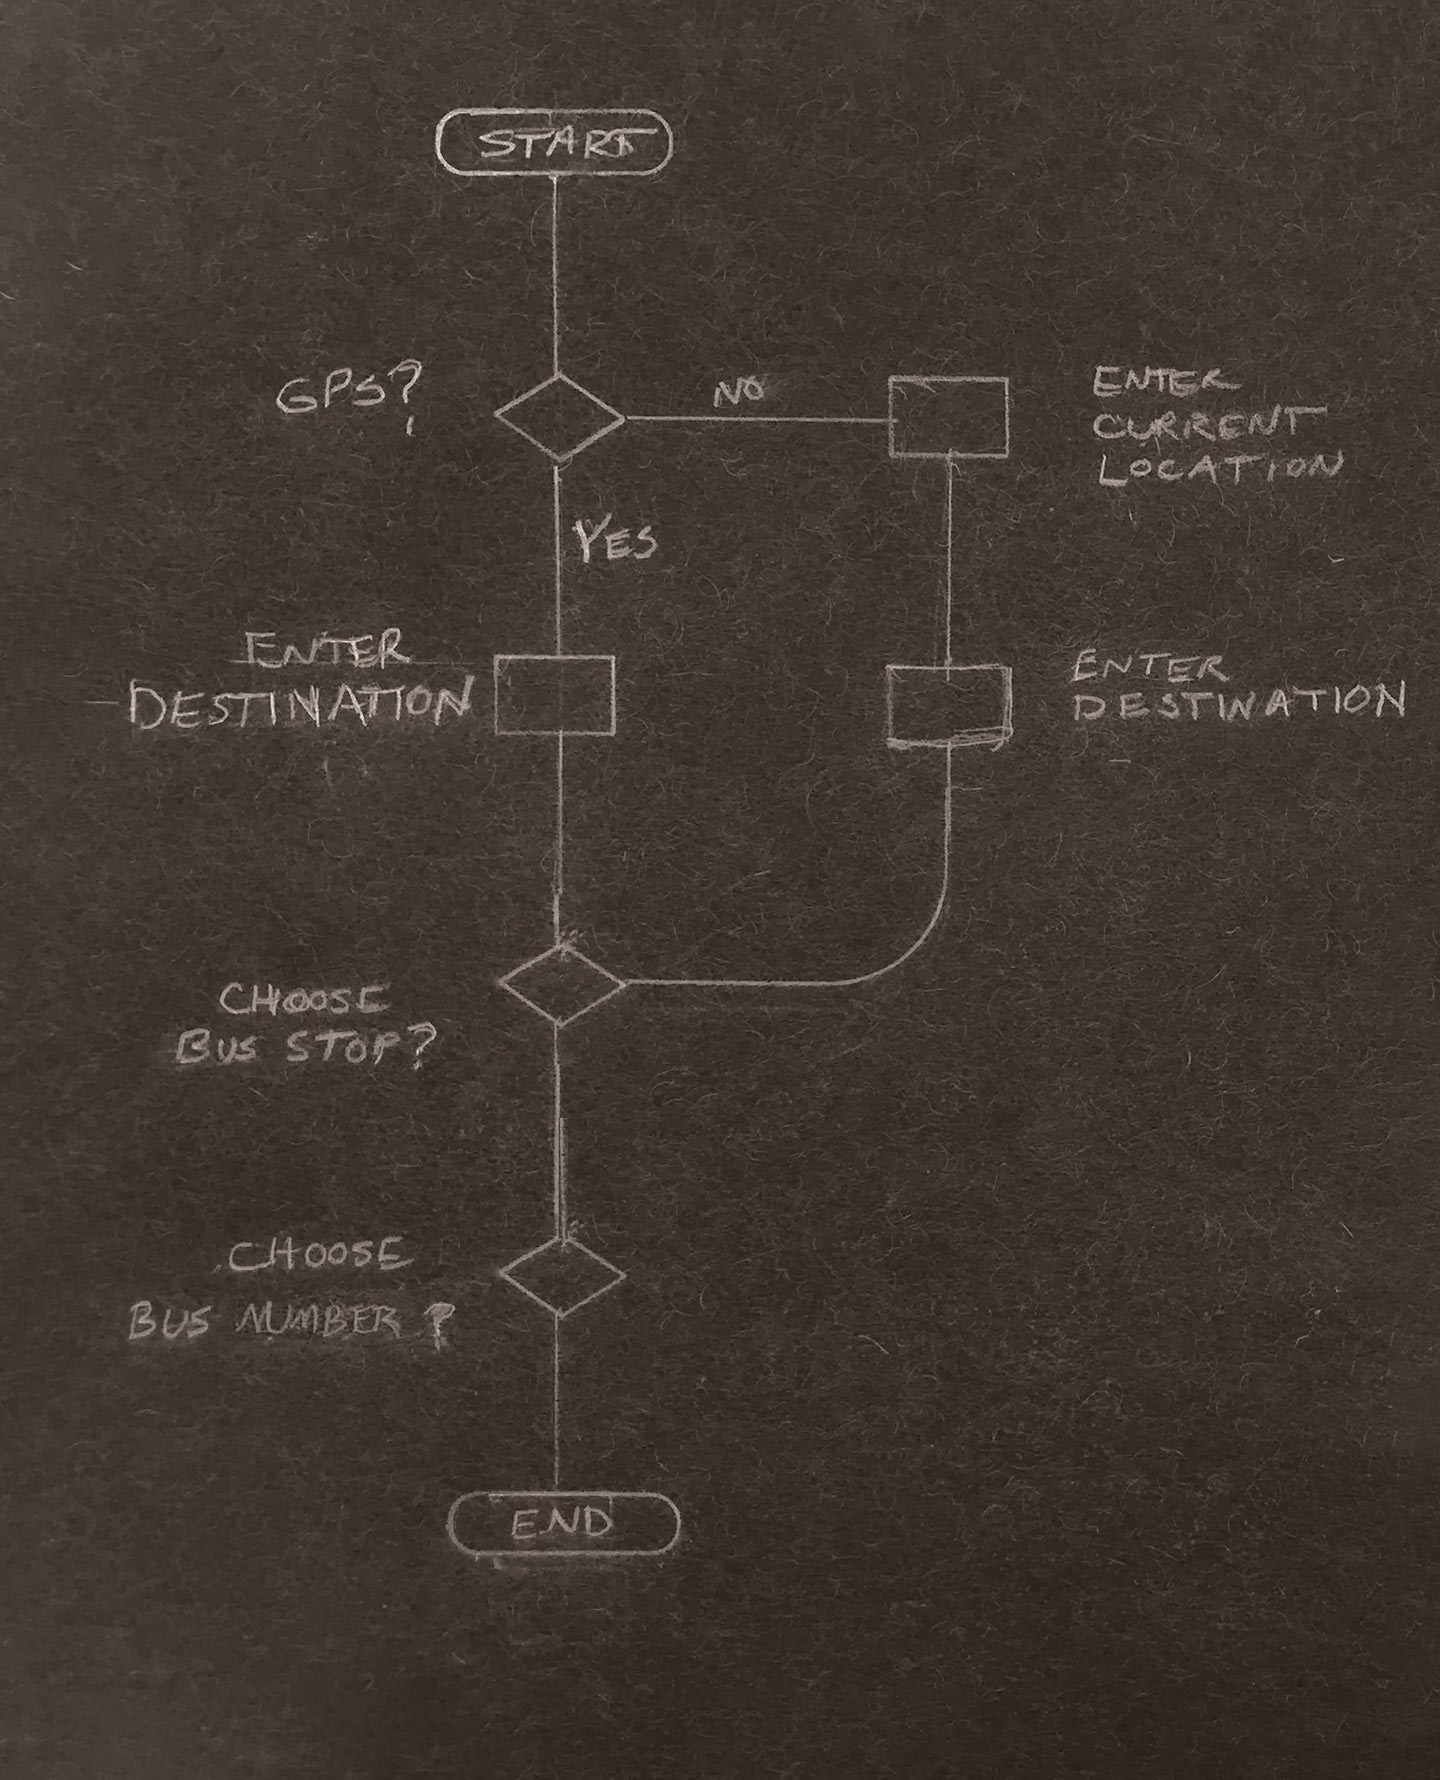
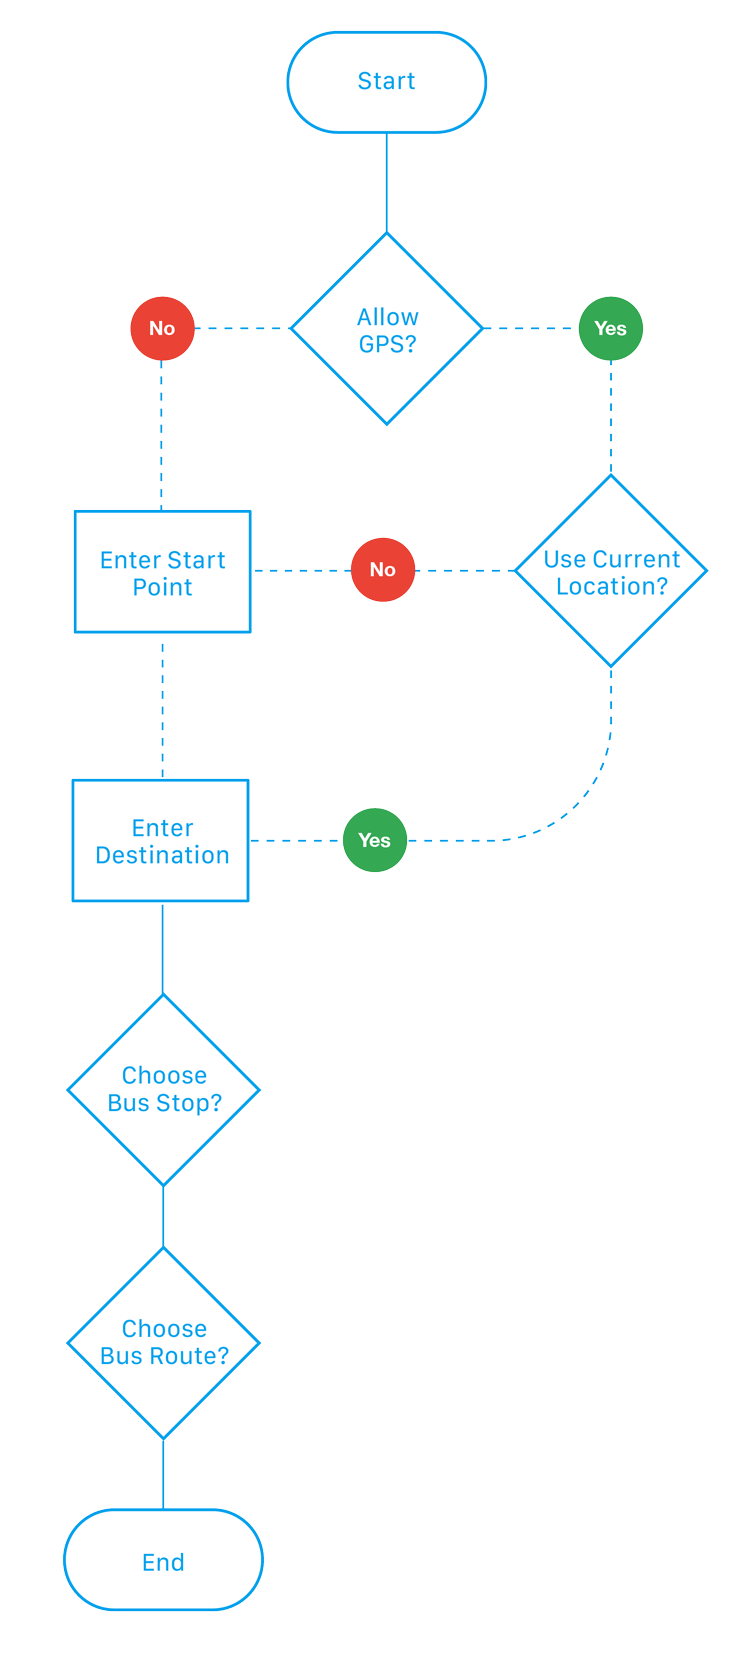
User flow sketch version 1 began the process of creating the user flow when I uncovered a potential gap in the flow that needed to be addressed.
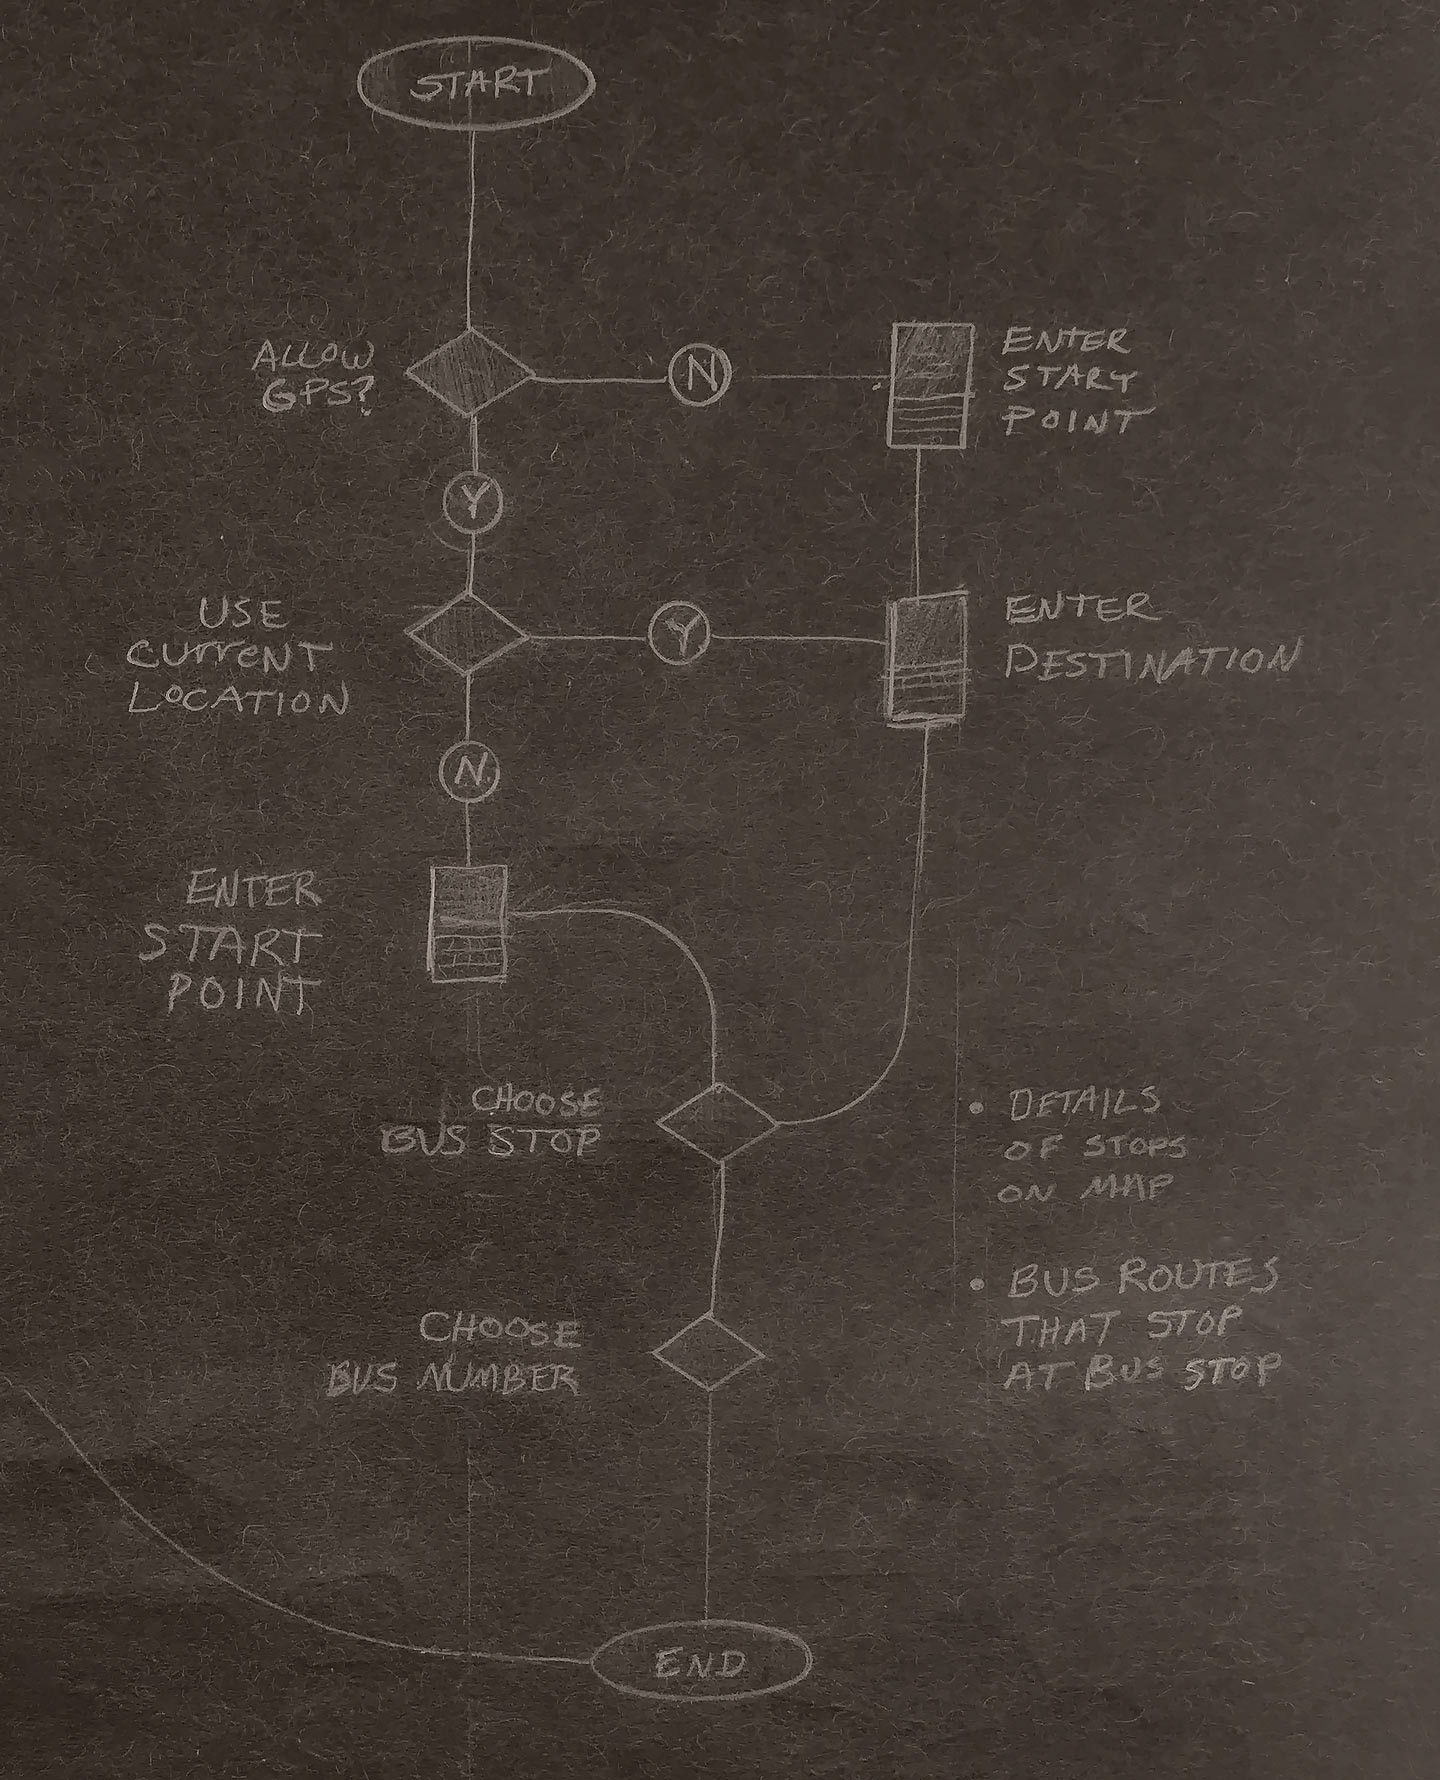
Version 2 added a decision point that states "Do you want to use your current location as your starting point?".
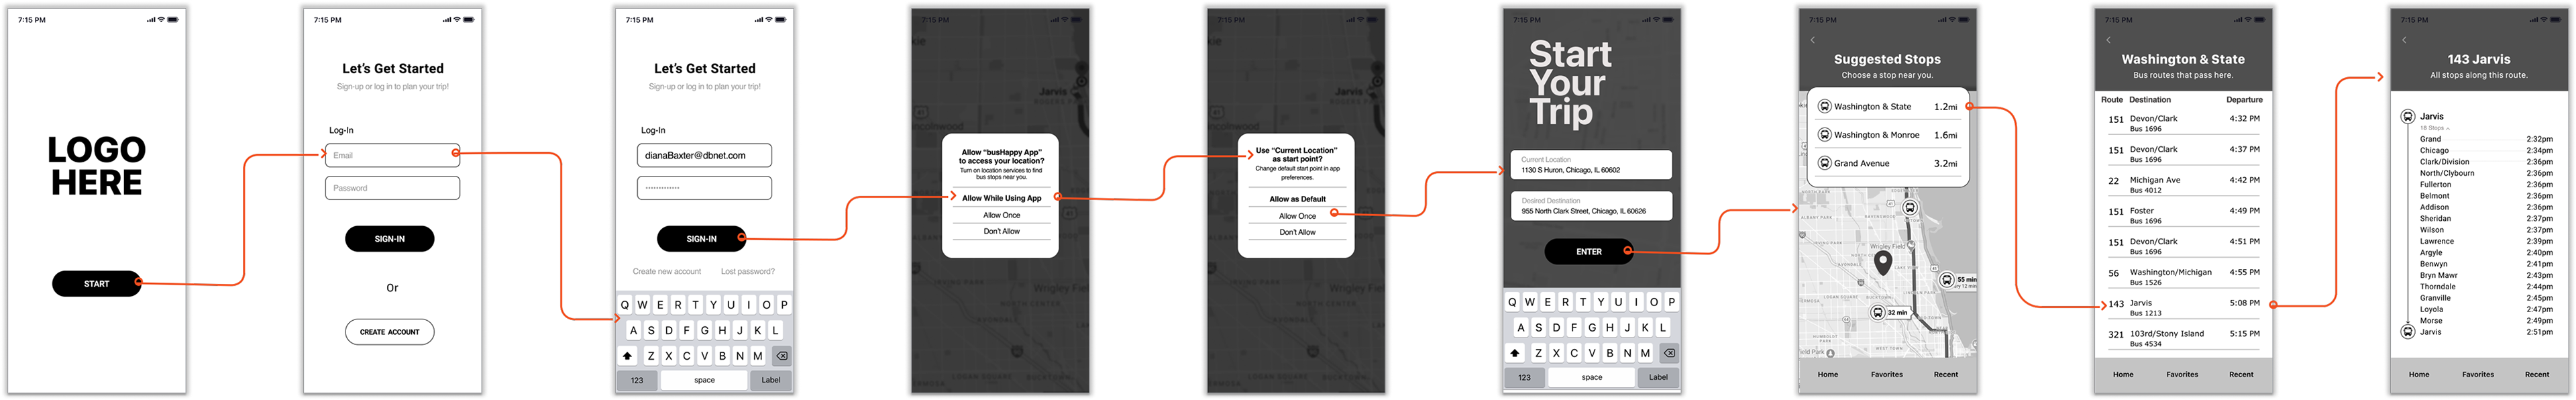
Wireframes
A wireframe was generated based on the interviews, surveys, and personas. It was important to maintain that simple and easy to use feel throughout the app
Logo & Badge Ideation
The journey into branding for this app began by listening to the users and striving for something that was what targeted just for them. Beginning with the name "Bus Happy" the app was to be bring calm assurance and a general sense of being happy throughout the day.
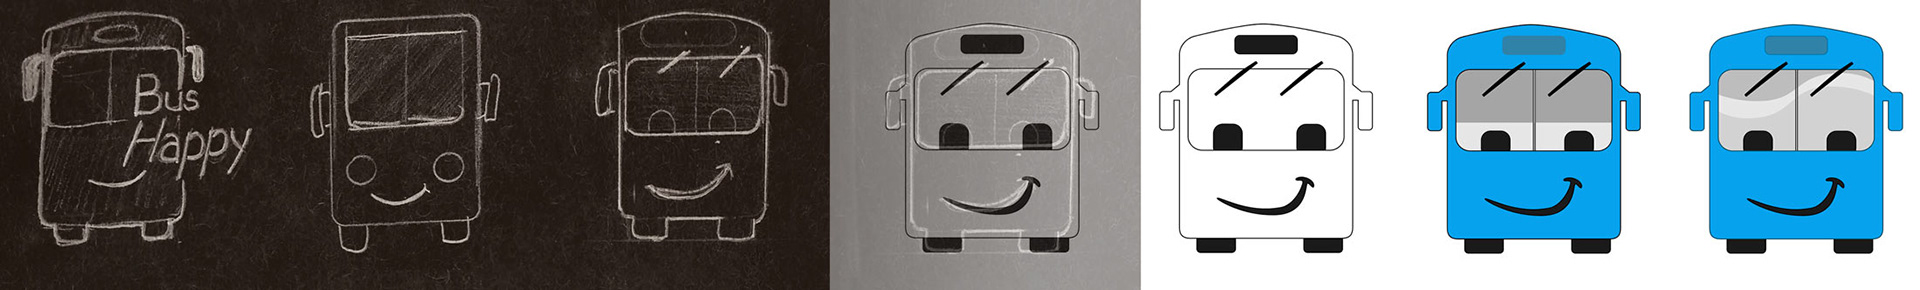
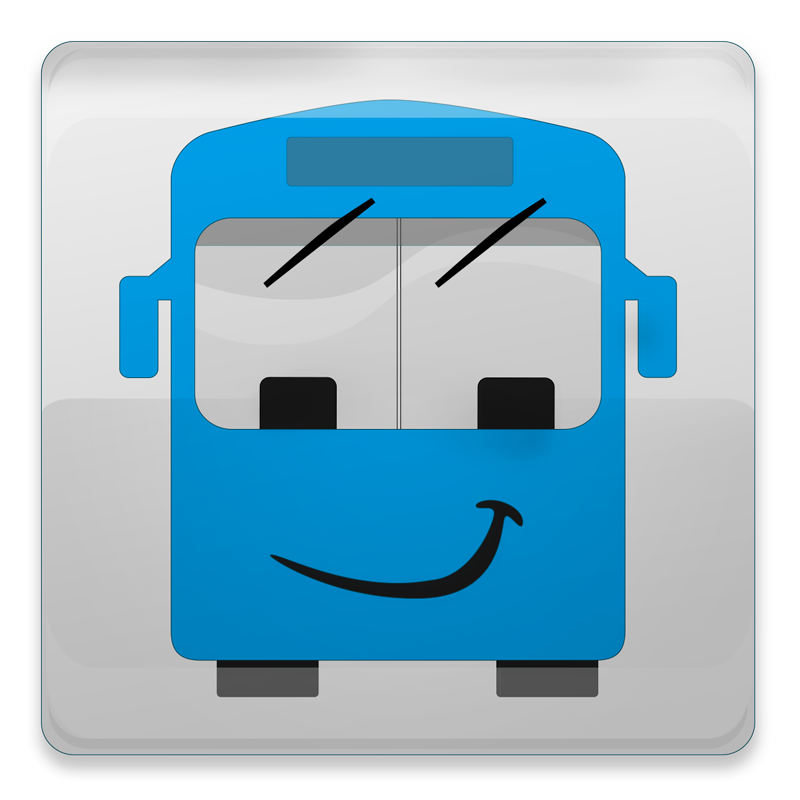
App/Play Store Badge Logo
Prototype
During the definition phase of the project a competitive analysis, user survey, interviews and analysis were done in order to create the most user-centric experience possible by getting well balanced data.
Gotta project?
Have questions?